Lecture 13: D3.js

Web Programming

J Mwaura

D3.js

D3.js a JavaScript library for manipulating documents based on data

D3.js (Data-Driven Documents) is designed to produce dynamic, interactive data visualizations in web browsers

It's an open framework

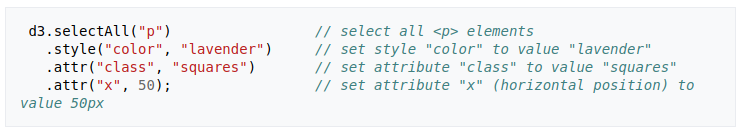
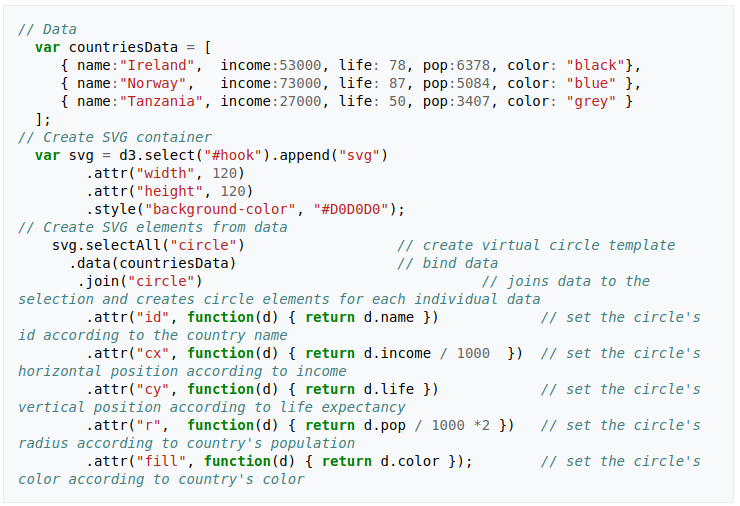
The beauty of D3 is that it allows you to associate data and what appears on the screen in a way that directly links the two

It makes use of Scalable Vector Graphics (SVG), HTML5, and Cascading Style Sheets (CSS) standards

Skill set needed

  • HyperText Markup Language (HTML)
  • JavaScript
  • Cascading Style Sheets (CSS)
  • Web Servers
  • PHP

Technical principles

D3.js library uses pre-built functions to select elements, create SVG objects, style them, or add transitions, dynamic effects or tooltips to them

These objects can also be styled using CSS

Large datasets can be bound to SVG objects using D3.js functions to generate text/graphic charts and diagrams

The supported data formats includes JSON, CSV or geoJSON

API structure

D3.js API contains several hundred functions, and they can be grouped into following logical units:

  • Selections ∘ Transitions ∘ Arrays
  • Math ∘ Color ∘ Scales
  • SVG ∘ Time ∘ Layouts
  • Geography ∘ Geometry ∘ Behaviors

Selections

The central principle of D3.js design is to use a CSS-style selector to select a given set of Document Object Model (DOM) nodes

Then, use operators to manipulate them

Selection can be based on an HTML tag, class, identifier, attribute, or place in the hierarchy

This process of modifying, creating and removing HTML elements can be made dependent on data, which is the basic concept of D3.js

Transitions

By declaring a transition, values for attributes and styles can be smoothly interpolated over a certain time

Data-binding

Adding data drives the creation of elements

D3.js loads a given dataset, then, for each of its elements, creates an SVG object with associated properties (shape, colors, values) and behaviors (transitions, events)

Maths

Generation of pseudorandom numbers with normal, log-normal, Bates, and Irwin-Hall distributions

Transformations in 2D: translation, rotation, skew, and scaling

Arrays

D3.js array operations are built to complement existing array support in JavaScript

D3.js extends this functionality with:

  • Functions for finding minimum, maximum, extent, sum, mean, median, and quantile of an array
  • Functions for ordering, shuffling, permuting, merging, and bisecting arrays
  • Functions for nesting arrays
  • Functions for manipulating associative arrays
  • Support for map and set collections

Geometry

Computing convex hull of a set of points

Computing Voronoi tesselation of a set of points

Support for point quadtree data structure

Support for basic operations on polygon

Color

Support for RGB, HSL, HCL, and L*a*b* color representation

Brightening, darkening, and interpolation of colors

Let's do this

Example 0

Example 1

End of Lecture 13

Web Programming

That's it!

Queries about this Lesson, please send them to: jmwaura@jkuat.ac.ke

*References*

  • Google Maps; Power Tools for Maximizing the API, 2014 Evangelos Petroutsos
  • D3 Tips and Tricks; Interactive Data Visualization in a Web Browser, 2013 Malcolm Maclean
  • Interactive Data Visualization for the Web, 2013 Scott Murray
  • Web Programming with HTML5, CSS, and JavaScript, 2019 John Dean
  • Leaflet Documentation Leaflet Team
  • Google Documentation for developers Google Team
Courtesy of
Web Programming