- Processing, analyzing data gathered by airborne and satellite sensors;
Lecture 8: Data Analysis in GIS
GIS & Remote Sensing
J Mwaura
Lecture Outcome
Function of Maps
- Share knowledge about our world
- Identify what is at a location
- Locate where you are
- Identify distributions, relationships, & trends not otherwise visible
- Integrate data from diverse sources into a common geographic reference
- Find the best path between one place & another
- Model future events
Data Collection Workflow
- Planning
- Preparation
- Digitizing and transfer
- Editing and improvement
- Evaluation
Data Types
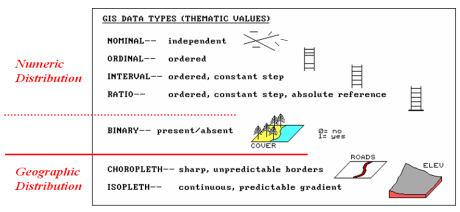
Data Values
- Nominal - just gives a name, an identifier. No computational information but useful in distinguishing different values
- Ordinal - this assigns rank to events or objects. It is a natural order for example first, second, third or ranking household income as high, average or low
- Interval - incremental; no multiplying or division but you can express ratios or differences, for example, age
- Ratio - length or area
Geographic Data Types
- Spatial Map Data this is the location and shape of an event or feature
- Attribute Data This is Descriptive data. It identifies what the map data is. These are all considered non-spatial because by themselves they do not pinpoint a location. It can be qualitative (nominal data) or quantitative (ordinal, interval or ratio data)
- Image Data satellite image, aerial photographs and scanned maps fall into this category
Geographic Data Types
Data Models
Digital representation of physical or man made elements in GIS
- Vector Data - (geo-objects) features are represented as Points, Lines, Polygons
- Raster Data - Store features on a grid or as pixels e.g. Images, & digital photographs

Vector Data (Database oriented)
The data is discrete
Examples are Shapefiles (Esri), Triangulated Irregular Networks (TINs) and AutoCAD (.dxf files)
- Points are non dimensional defined by x, y coordinates
- Polygons are the enclosure of one or more lines
Vectors are more database oriented and are very good at representing features such as rivers, boundaries and roads
Sources - GPS Surveys, manual digitizing
Raster Data (Analysis oriented)
This model uses grids to store map data. It creates a continuous surface defined by series of discrete grid cells. Each cell has a value that represents attribute data at that location
Cell size determines resolution. The smaller the cell size the better the resolution. For example a 50 meter Landsat image means that each cell is 50 meters on the ground. A smaller cell size means more details
The data is a continuous representation of a study area and is therefore suited to data that is continuous such as terrain, vegetation and natural resources. With raster data you can create atmosphere models, density models and remotely sensed data
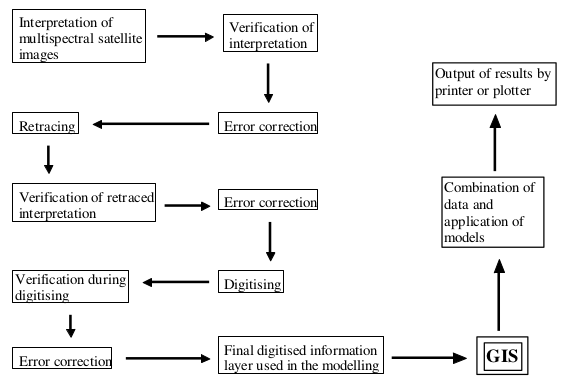
Data Capture & Editing
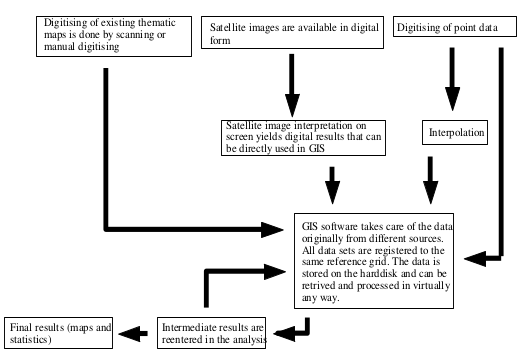
Interpretation of Satellite Images
GIS Data Sources
Primary sources
Raster:
- Remote sensing
Vector:
- Surveying
- GPS
GIS Data Sources
Secondary sources
Raster:
- Scanning
Vector:
- Digitizing
- Vectorization
- Conversion
Data Editing
The input GIS data that is encoding may consist errors derived from the original data source or introduced during the encoding process
Data editing & verification is in response to the errors that arise during the encoding of spatial & non-spatial data
Sources of Errors
- Incompleteness of the spatial data
- Locational placement errors of spatial data
- Incorrect linkages between spatial & attribute data
Data Quality Components
Data quality is the degree of data excellency that satisfy the given objective
Data quality components are the key elements to explain quality of the data and the results of the data analysis
These components of data quality includes:
- Data accuracy
- Data completeness
- Data precision
- Data consistency
- Data lineage
Accuracy
Accuracy is the closeness of results of observations to the true values or values accepted as being true
Basically two types of accuracy exist;
- Positional accuracy - deviance in the geographic location of an object from its true ground position
- Attribute accuracy - estimates of the truth
Precision
Precision refers to the amount of detail that can be distinguished
Precision affects the degree to which a database is suitable for a specific application or level of generalization
Generalization includes elimination & merging of entities, reduction in detail, and aggregation of classes
Completeness
Its the measure of totality of features or shows how much data is missed from the original
This includes consideration of holes in the data, unclassified areas, and any compilation procedures that may have caused data to be eliminated
Consistency
The absence of conflicts in a particular database
This typically involves spatial or topological errors/inconsistencies such as incorrect line intersections, duplicate lines or boundaries, or gaps in lines
It determines the faithfulness of the data structure for a data set
Lineage
Describes the history of a data set
Contains information about how, when, where & who has build the data set
It contains information which describes;
- Source of the data
- Content of the data
- Data capture specifications
- Geographic coverage of the data
- Compilation method of the data
GIS Functions (What can GIS Do?)
The 5Ms of GIS
- Mapping
- Measurement
- Monitoring
- Modelling
- Management
General purpose GISs
- Input
- Manipulation
- Management
- Query
- Analysis
- Visualization
GIS Analysis Functions
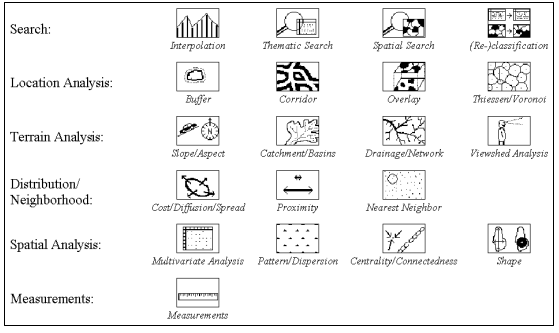
Mapping & Measurement
Where are we?
How far is the nearest hospital from the site of the accident?
What is the size of Kenya Tea Development Corporation?
Monitoring
What would happen if . . . A chemical leaked into a Ruiru river?
Where does . . . Flooding occur most in Nyando?
Has . . . Population changed over the last ten years?
Is there a spatial pattern related to . . . Volume rainfall and location of landslide
Modelling
Simplified representation of a phenomenon or system
Utilizes a set a of transformation tools that derive new geographic datasets from existing datasets
Geo-processing functions take information from existing datasets, apply analytic functions, and write results into new derived datasets.
Visualizing Different Types of Data
To find the proper symbology for a map, one has to execute a cartographic data analysis
Data will be of a qualitative or quantitative nature
- Qualitative/nominal data - exists as discrete, named values without a natural order amongst the values
- Quantitative data - can be measured, either along an interval or ratio scale
Mapping Qualitative Data
Information about qualities; information that can't actually be measured. Deals with descriptions. Data can beobserved but not measured. Examples
- Land cover classes(farm land, urban area, grass land)
- Soil types
- Political administration divisions
The application of colour would be the best solution
The colours used have to be of equal visual weight or brightness
Each of the elements should get equal attention, and none should stand out above the others
Correct Maps
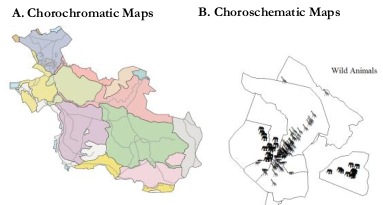
Incorrect Maps
Mapping Quantitative Data
Deals with numbers. Data which can be measured and ranked. Examples
- Length, height, area, volume, weight, speed, time, temperature, humidity, sound levels, cost, members, ages, etc
We use two types of quantitative data in the realm of GIS
- Absolute quantitative data
- Relative quantitative data
Mapping Absolute Quantitative Data
Absolute quantitative data describe intrinsic characteristic of the feature being measured
To map absolute quantitative data the symbols used should have quantitative perception properties
Symbols varying in size with varying in quantity
Correct Maps
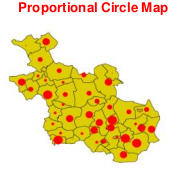
Incorrect Maps
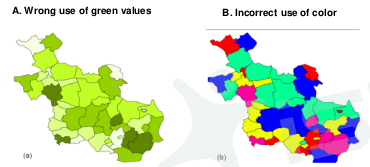
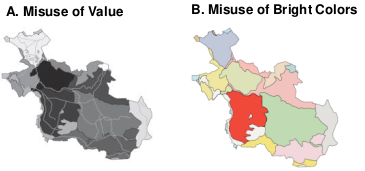
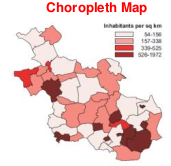
Mapping Relative Quantitative Data
Relative quantitative data is data related to geographic distributions
The size of the geographic unit will influence the perceptional properties too much
The numbers now have a clear relation with the area they represent
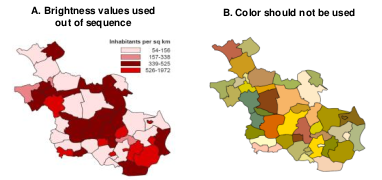
Value(brightness) is the best method of mapping Relative quantitative data
Correct Maps
Incorrect Maps
Lab Session
- Download and processing satellite image
- Download Kenya population 2019, and make population density map
- Make a map of main economy activity in Kenya by county
End of Lecture
GIS & Remote Sensing
That's it!
Queries about this Lesson, please send them to:
*References*
- Geographic Information System Basics, 2012
J.E.Campbell & M. Shin- Fundamentals of GIS, 2017
Girmay Kindaya- GIS Applications for Water, Wastewater, and Stormwater Systems, 2005
U.M. Shamsi- Analytical and Computer Cartography, 2nd ed.
Keith C. Claike- Geographic Information Systems: The Microcomputer and Modern Cartography, 1st ed.
Fraser Taylor
Courtesy of Open School