- Lectures - online | onsite
- Practicals
- Assignments
- Presentations
Lecture 1: Basics of GIS
J Mwaura
Mode of Delivery
Course Outline
Introduction to GIS & Remote Sensing
- Basics of GIS and Remote Sensing;
- Relief representation; contour interpolation; map design and compilation;
- Thematic mapping techniques of enhancement and qualification of remote sensing imagery;
- Processing, analyzing data gathered by airborne and satellite sensors;
- Use and handling of drawing instruments; freehand lettering and drawing;
- Computer and digital mapping
What is GIS?
Original GIS Definition
GIS = Geography + Information Systems
Information System A sequence of operations that takes us from planning and collection of data, to storage and analysis of the data, to the use of the derived information in some decision-making process
A GIS is an information system designed to work with data referenced by spatial or geographic coordinates
GIS helps to answer spatial questions (based on relationships, locations etc.) - decision making support tool
Popular GIS Definition
A GIS is an organized collection of computer hardware, software, geographic data, and personnel designed to effectively capture, store, retrieve, update, manipulate, analyze, and display all forms of geographically referenced information
GIS is a computer system capable of assembling, storing, manipulating, and displaying geographically referenced information, (i.e., data identified according to their location) as well as operating personnel
A computer system capable of handling and using datadescribing places on the earth's surface (Borrough 1998)
It is an integrated system of computer hardware and software coupled with procedures and a human analyst which together support the capture, management, manipulation, analysis, modelling and display of spatially referenced data
The answer to all spatial questions is through GIS
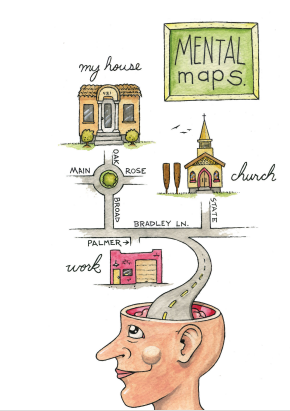
Key geographic concepts
- Location; by name, LatLong, compass
- Direction; using references or benchmark
- Distance
- Navigation
Why is GIS unique?
Geo
Geography is information about the earth's surface and the objects found on it, e.g. people, trees, buildings, roads, shoreline etc.
GIS then provides a system for organizing this knowledge. GIS helps manage, analyze, and distribute geographic knowledge.
- Information referenced by its location in space
GIS makes connections/relationships between activities based on spatial proximity
1st Law of Geography: everything is related, closer things are more related than distant things
GIS Today
GIS is an information technology that integrates spatial data and information from various sources for mapping, monitoring & modelling
Maps today are colorful, searchable, interactive, and shared - the key technology behind all this GIS
GIS - can help us understand and relate to the "what," "when," "how," and "why" of the world by answering "where." - The science of where
GIS is used to; ask questions, inform choices, and guide policy
Why does GIS matter?
Knowing where something happens is of critical importance
Geographic location is an important attribute of activities, policies, strategies, and plans
There 3 bases for classifying geographic problems
- the scale or level of geographic detail
- the intent or purpose e.g. finding new locations or predicting behavior based on location
- the timescale
Question: Where did my ancestors come from? Illustrates curiosity driven research
Definition of Terms
Data are raw facts, neutral and context-free, internal meaning is irrelevant
Information is processed data for some purpose or that have been given some degree of interpretation
Knowledge is information to which value has been added by interpretation based on a particular context, experience, and purpose
Evidence is halfway between information and knowledge
Wisdom used in the context of decisions made or advice given
Systems and Science
GIS are computer-based systems for collecting, storing and processing geographic information
GI Science (GISc) is the scientific context and underpinnings of geographic information systems
The Science of Problem Solving
Knowledge about how the world works (process) is more valuable than knowledge about how it looks (form), because such knowledge can be used to predict
GIS is useful as a tool for problem solving because it combines the general with the specific
- Software captures and implements general knowledge
- The database represents specific information
General knowledge for problem solving comes in many forms
- Classifications
- Rule sets, some based on statistical generalisations
- Laws
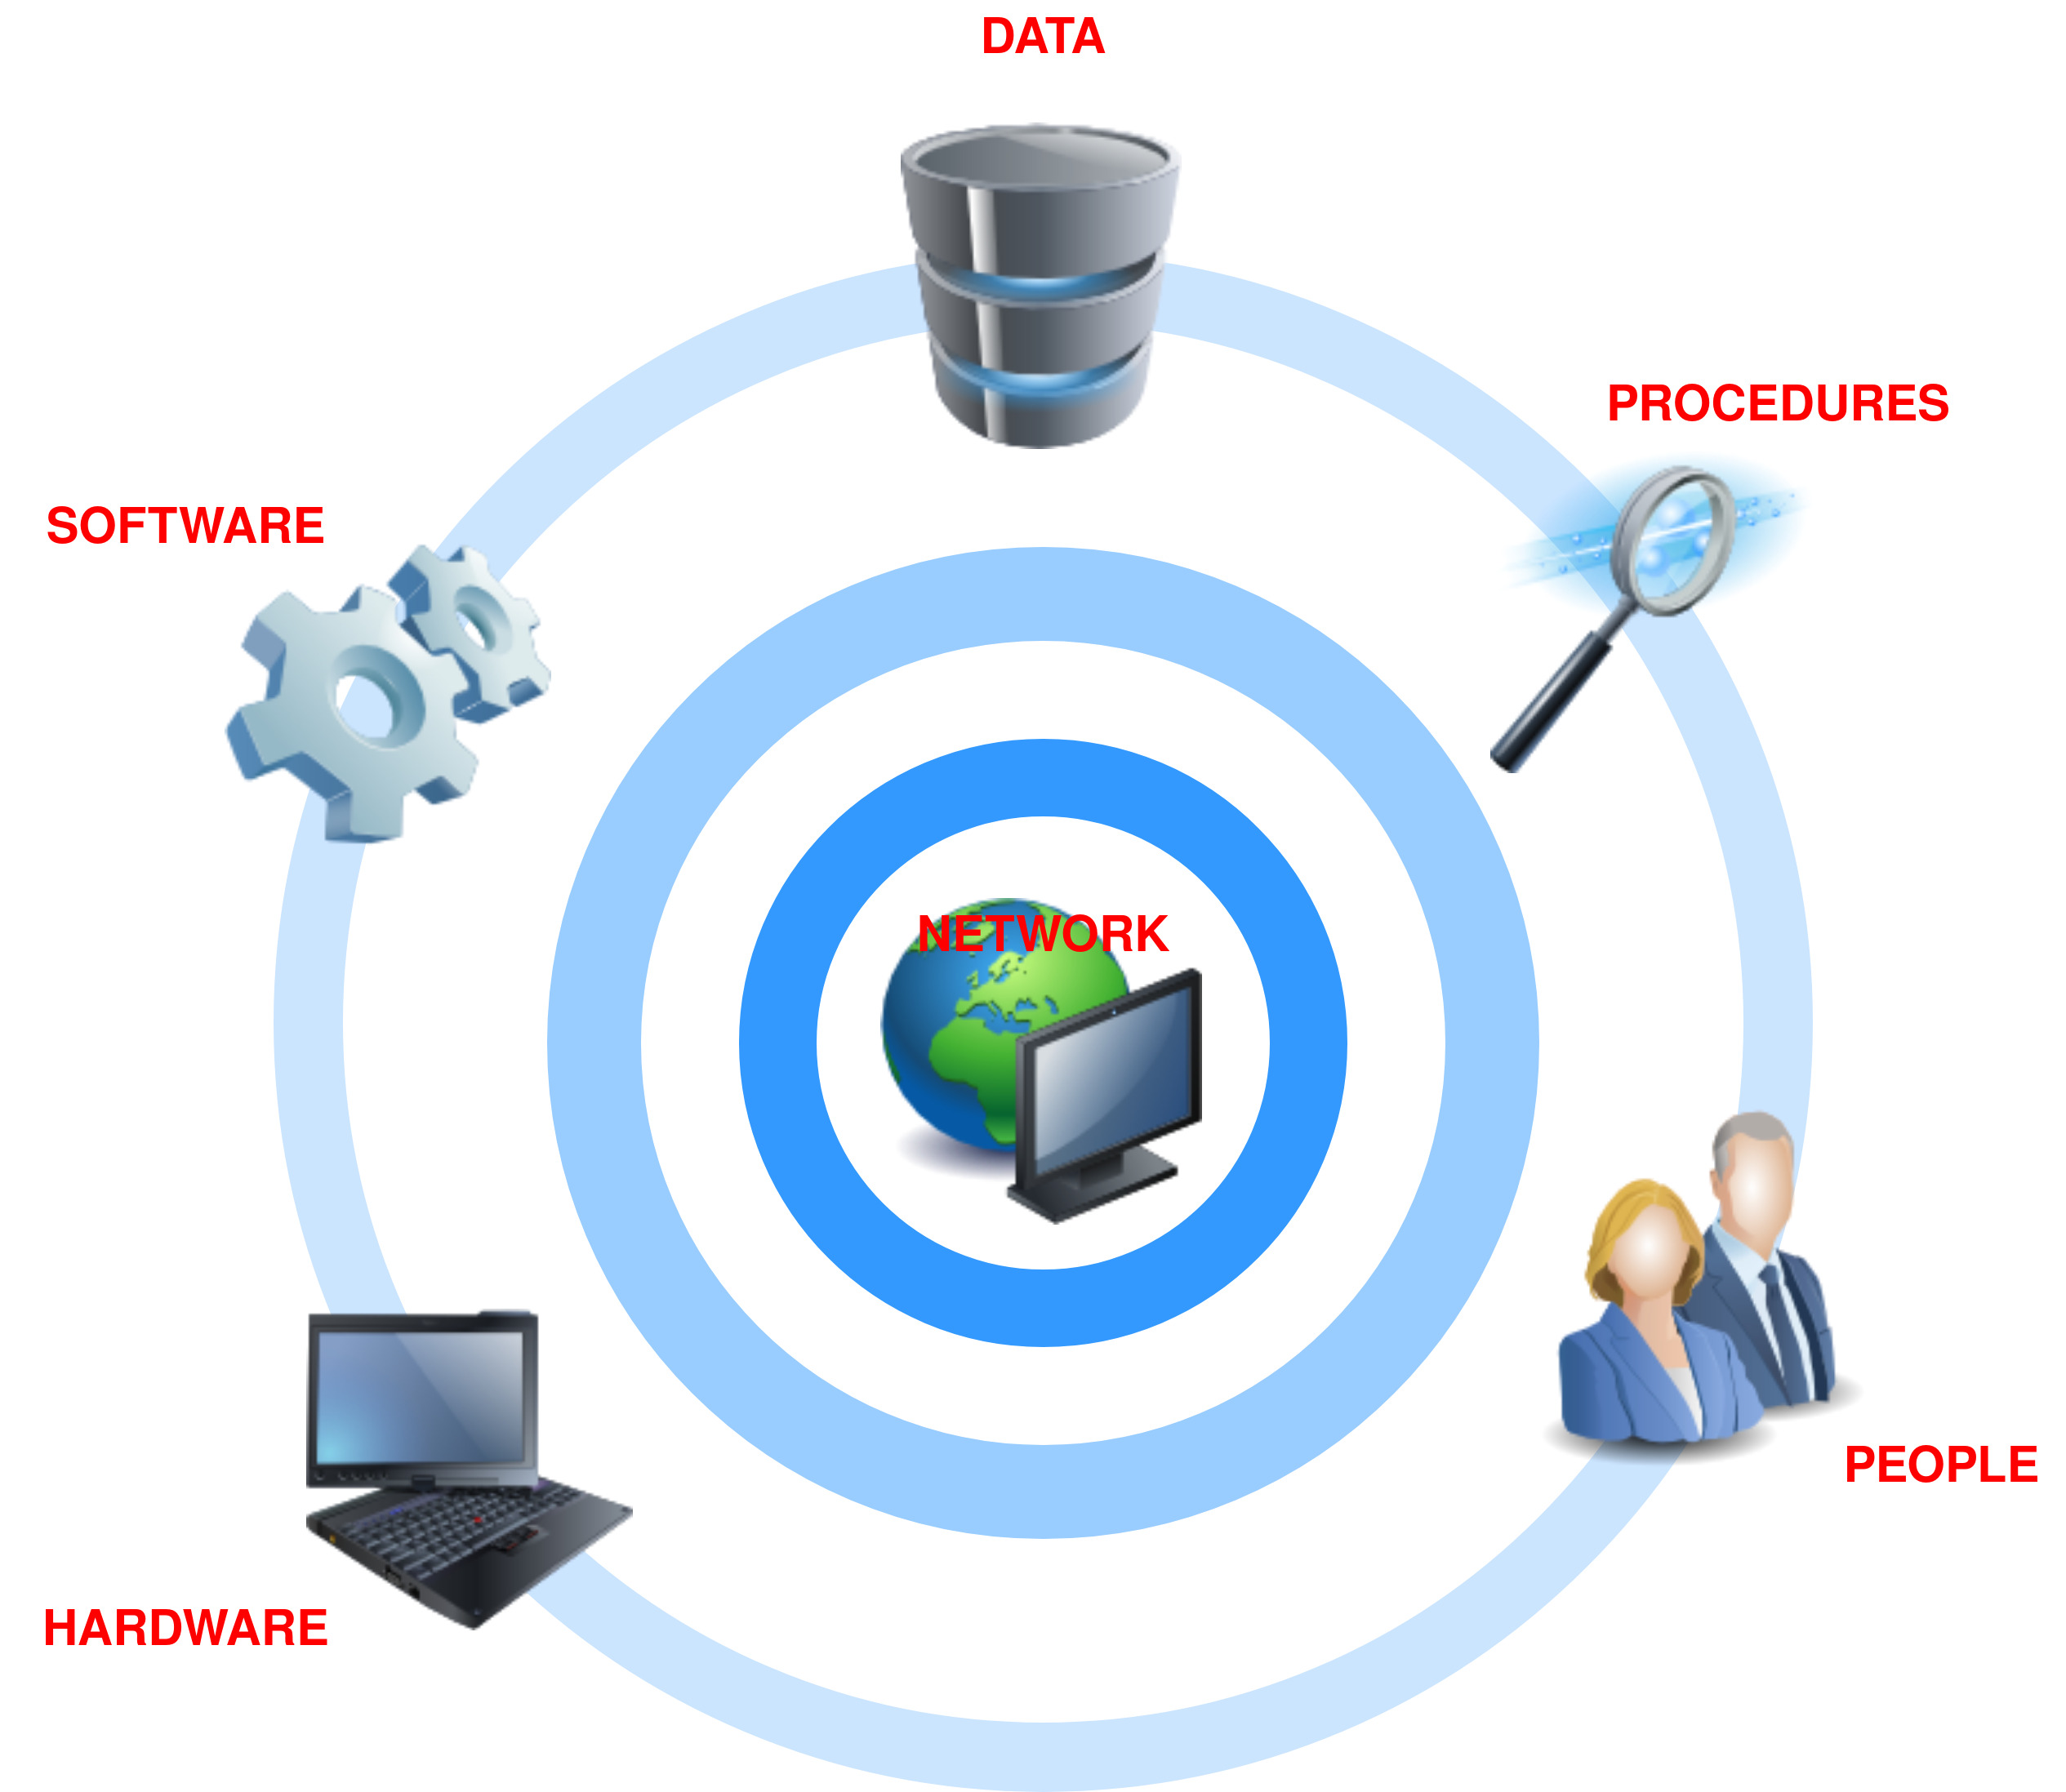
Anatomy of a GIS
A working GIS integrates these five key components: hardware, software, data, people, and methods/applications
Component: Hardware
Devices can be categorized in four general ways:
- Data collection GPS, Cameras
- Data Input Scanners, Digitizers
- Data Output Printers, Computer monitors, Projectors
- Data analysis and storage Computers, hard drives
Component: Software
GIS software provides the functions and tools needed to store, analyze, and display geographic information. Key software components are
- A database (management system)
- Tools for the input and manipulation of geographic information
- Tools that support geographic query, analysis, and visualization ArcGIS, QGIS, MapInfo, GRASS, Geomedia, AutoCAD
- A graphical user interface (GUI) for easy access to tools
- Remote Sensing Softwares include ERDAS Imagine, ENVI, ILWIS, PCI Geomatica, Ecognition, ER Mapper etc
A well rounded GIS package has tools to support both vector and raster analysis
Component: Data
Data fuels a GIS. Most GISs create and maintain a database to help organize and manage data
In GIS project, crucial & costly steps are data capture, data assembl & data integration
Data available for integration includes points, areas, images & grids
Component: Procedures
Refers to steps taken to resolve a problem; guidelines, specifications, standards & procedures
Procedures include how the data will be retrieved, input into the system, stored, managed, transformed, analyzed, and finally presented in a final output
An organisation is responsible to establish procedures, lines of reporting, control points, and other mechanisms for ensuring that its GIS activities stay within budgets, maintain high quality, and meet their needs
Component: People
People designs, sell & use GIS. Without people, there is no GIS
GIS users range from technicians to specialists, who design and maintain the system
GIS personnel have various skills, depending on the roles they perform in working with geographic data
Component: Networks
GIS & Internet are heavily intertwined
Today, Internet has proven very popular as a vehicle for delivering GIS applications
GIS has adopted Internet paradigm as service e.g. Google Earth Engine
The business of GIS
Includes:
- The software industry
- The data industry
- The GIService industry
- The GeoWeb Service industry
- The publishing Industry
- GIS education
What makes data spatial?
Geography is, in fact, the study of spatial information and we are surrounded by geography.
Spatial data has particular characteristics that can be described in terms of: shape, place and relationship to other spatial data

Tabular and attribute data are non-spatial but can be linked to location data
GeoReferencing
GeoReferencing- Assigning real-world coordinates to each pixel of the raster or associating raster data with locations in physical space
GeoCoding- Assigning latitude and longitude to phenomena on the earth's surface
GIS System
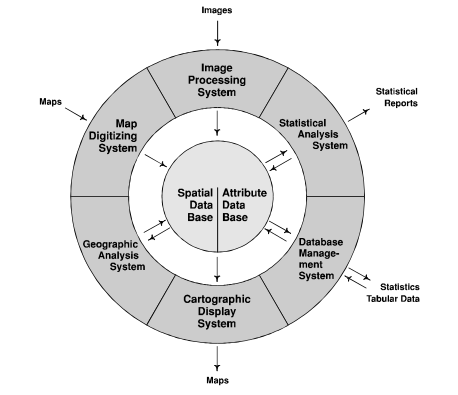
GIS Subsystems
GIS has 4 main functional subsystems
- A data input subsystem
- A data storage & retrieval subsystem
- A data manipulation & analysis subsystem
- A data output & display subsystem
Functional Subsystems
- Data Input
- Allows the user to capture, collect, & transform spatial and thematic data into digital form
- Data are usually derived from hardcopy maps, aerial photographs, remotely sensed images, reports, survey observations/documents, etc
- Data Storage & Retrieval
- Organizes the data, spatial & non-spatial, in a form which permits it to be quickly retrieved by the user for analysis
Functional Subsystems
- Data Manipulation & Analysis
- Allows the user to define & execute spatial & non-spatial procedures to generate derived information
- This is the heart of a GIS
- Data Output
- Allows the user to generate graphic displays, normally maps, & tabular reports representing derived information products
Representing Geography
Representations are reinforced by the rules and laws that we humans have learned to apply to the unobserved world around us, such as using spatial interpolation to guess the conditions that exist in places where no observations were made
Introduces Tobler's First Law of Geography: Everything is related to everything else, but near things are more related than distant things
Digital representation introduces the notions of digital and binary
Fundamentals about the binary number system, including short (16-bit) and long (32-bit) storage, ASCII, floating point numbers, and BLOBs (binary large object)
Benefits of digital representations of geography include: can be handled in ways that are independent of meaning; easy to copy and transmit; stored at high density; easy to transform, process, and analyze.
The Fundamental Problem
Geographic data are built up from atomic elements, or facts about the geographic world
At its most primitive, an atom of geographic data (strictly, a datum) links a place, often a time, and some descriptive property
Attribute refers to this descriptive property and may
- vary slowly or rapidly
- be physical/environmental or social/economic
- identify a place or entity
- provide a measurement of something at that place
Types of attributes: nominal, ordinal, interval, ratio, and cyclic
The fundamental problem is - the world is infinitely complex, but computer systems are finite
Discrete Objects
In the discrete object view, the world is empty, except where it is occupied by objects with well-defined boundaries that are instances of generally recognized categories
- Objects can be counted
- Objects have dimensionality: 0-dimension (points), 1-dimension (lines), 2-dimensions (areas, polygons)
3-dimensions are problematic in GIS
Associating attributes to discrete objects can be expressed in a table
- each row corresponding to a different discrete object
- each column corresponding to an attribute of the object
A table does not look like the real world
Continuous Fields
The continuous field view represents the real world as a finite number of variables, each one defined at every possible position
Continuous fields, on the other hand, can be distinguished by what varies, and how smoothly
Rasters and vectors
Raster and vector are two methods that are used to reduce geographic phenomena to forms that can be coded in computer databases
In principle, each can be used to code both fields and discrete objects, but in practice there is a strong association between raster and fields, and between vector and discrete objects
Raster data
n a raster representation geographic space is divided into an array of cells, each of which is usually square, but sometimes rectangular
All geographic variation is then expressed by assigning properties or attributes to these cells
The cells are sometimes called pixels (short for picture elements)
When information is represented in raster form all detail about variation within cells is lost, and instead the cell is given a single value based on a rule such as largest share or value at the central point
Vector data
Usually, in a vector representation, all lines are captured as points connected by precisely straight lines (some GIS software also allows curves)
Features are captured as a series of points or vertices connected by straight lines
- areas are often called polygons
- lines are sometimes called polylines
Vector file formats

Representing continuous fields
The six approximate representations of a field used in GIS are
- Regularly spaced sample points
- Irregularly spaced sample points
- Rectangular cells
- Irregularly shaped polygons
- Irregular network of triangles
- Polylines representing contours
The paper map
Key property of a paper map is its scale or representative fraction, defined as the
ratio of distance on the map to distance on the Earth's surface
- when a scale is quoted for a digital database it is usually the scale of the map that formed the source of the data
- while the paper map is a useful metaphor for the contents of a geographic database, we must be careful not to let it limit our thinking about what is possible in the way of representation
Digital representations can include information that would be very difficult to show on maps
Digital databases can represent all three spatial dimensions, including the vertical, whereas maps must always show two-dimensional views
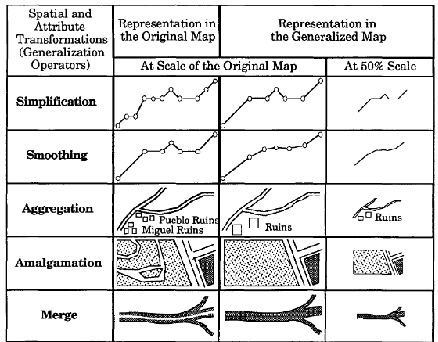
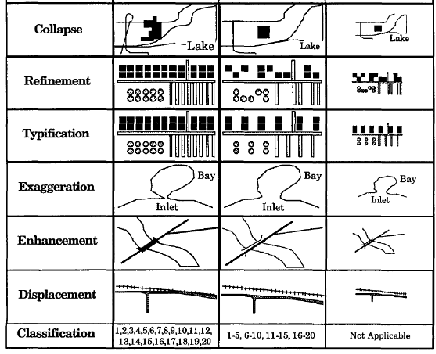
Generalization
Ways of simplifying the view of the world include
- describe entire areas, attributing uniform characteristics to them, even when areas are not strictly uniform
- identify features on the ground and describe their characteristics, again assuming them to be uniform
- limit our descriptions to what exists at a finite number of sample points, hoping that these samples will be adequately representative of the whole
- some degree of generalization is almost inevitable in all geographic data
A map's specification defines how real features on the ground are selected for inclusion on the map
Generalization about places
Generalization in GIS is used to reduce the detail in data
Geometry & Attribute generalization methods include
- Simplification
- Smoothing
- Aggregation
- Amalgamation
- Merging
- Collapse
- Refinement
- Exaggeration
- Enhancement
- Displacement
Weeding is the process of simplifying a line or area by reducing the number of points in its representation
Generalization Techniques
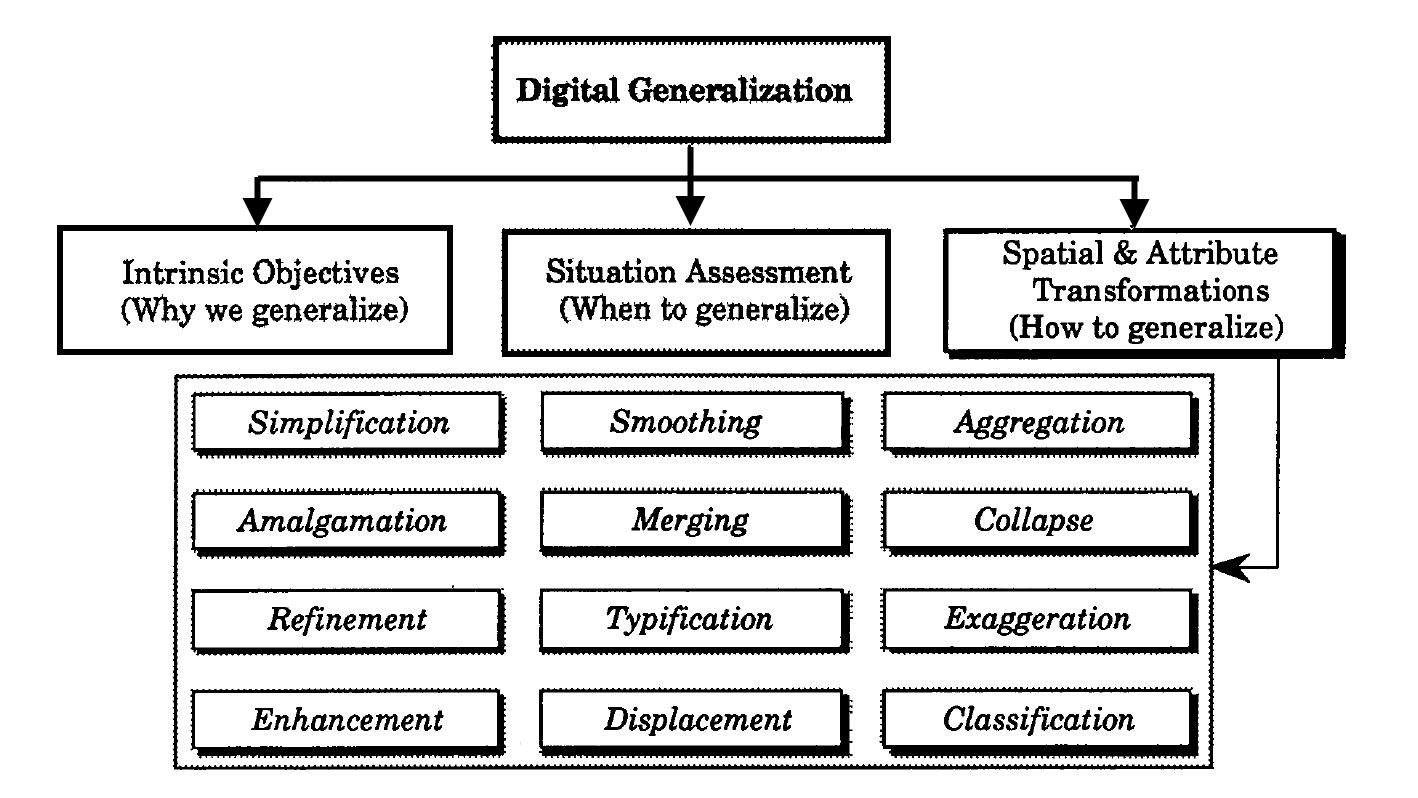
Generalization Techniques
The Nature of Geographic Data
What is the nature of spatial variation?
We focuses on how phenomena vary across space and the general nature of geographic variation
Describes the main principles that govern scientific sampling, how spatial variation is formalized and measured as spatial autocorrelation
- Distinguishes between
controlled variation, which oscillates around a steady state, anduncontrolled variation - Some applications address controlled variation, such as utility management
- Others address uncontrolled, such as those studying longer term processes
- Introduces the concept of time series and acknowledges the concept of
temporal autocorrelation Spatial heterogeneityis the tendency of geographic places and regions to be different from each other
Types of spatial objects
Classifies geographic objects by their topological dimension
Points, lines, area objects, volume objects, time (as the 4th dimension)
Classification of spatial phenomena into object types is dependent fundamentally upon scale
Spatial Autocorrelation and Scale
Spatial autocorrelation measures attempt to deal simultaneously with similarities in the location of spatial objects and their attributes
Measures of spatial and temporal autocorrelation are scale dependent
The issue of sampling interval is of direct importance in the measurement of spatial autocorrelation
When the pattern of spatial autocorrelation at the coarser scale is replicated at the finer scale, the overall pattern exhibits the property of self-similarity
Spatial Sampling
Sample frame is defined as the universe of eligible elements of interest.
Sampling is the process of selecting points from a continuous field or selecting some objects while discarding others
Any geographic representation is a kind of sample
Distance decay
Discusses the attenuating effect of distance and the need to make to make an informed judgment about an appropriate interpolation function and how to weight adjacent observations
Choropleth maps - describe properties of non-overlapping areas
Spatially extensive variables are true only of entire areas, such as total population, or
total number of children under 5 years of age
Spatially intensive variables could potentially be true of every part of an area, if the
area were homogeneous - examples include densities, rates, or proportions
Measuring distance effects as Spatial Autocorrelation
Induction reasons from data to build up understanding, while deduction begins with theory and principle as a basis for looking at data
The measurement of spatial autocorrelation is a more inductive approach to developing an understanding of the nature of a geographic dataset
- If the phenomenon is conceived as a field, then spatial autocorrelation measures the smoothness of the field using data from the sample points, lines, or areas that represent the field
- If the phenomena of interest are conceived as discrete objects, then spatial autocorrelation measures how the attribute values are distributed among the objects, distinguishing between arrangements that are clustered, random, and locally contrasting
Capabilities of GIS
There are five general types of geographic questions that we can ask and that GIS can help us to answer
- Questions about
geographic location - Questions about
geographic distribution - Questions about
geographic association - Questions about
geographic interaction - Questions about
geographic change
Geographic Location/Condition
What is it?Where is it?Why is it here or there?How much of it is here or there?
Geographic Distribution | Pattern Analysis
Is it distributed locally or globally?Is it spatially clustered or dispersed?Where are the boundaries?
Geographic Association | Modeling
What if ...?
What else is near it?What else occurs with it?What is absent in its presence?
Geographic Interaction | Modeling
What if ...?
Is it linked to something else?What is the nature of this association?How much interaction occurs between the locations?
Geographic Change | Trend Analysis
Has it always been here?How has it changed over time and space?What causes its diffusion or contraction?
GIS to Experts
GIS systems are used to organize, analyze, visualize, and share all kinds of data and information from different historical periods and at various scales of analysis
- To
climatologists - to understand the causes and consequences of global warming - To
epidemiologists - locating ground zero of a virulent disease outbreak - To
political consultants - developing campaign strategies for the next presidential election - To
Real estate consultants - developing sustainable development societal goals
End of Lecture
GIS & Remote Sensing
That's it!
Queries about this Session, please send them to:
*References*
- Geographic Information System Basics, 2012
J.E.Campbell & M. Shin- Fundamentals of GIS, 2017
Girmay Kindaya- GIS Applications for Water, Wastewater, and Stormwater Systems, 2005
U.M. Shamsi- Analytical and Computer Cartography, 2nd ed.
Keith C. Claike- Geographic Information Systems: The Microcomputer and Modern Cartography, 1st ed.
Fraser Taylor
Courtesy of Open School