CARTOGRAPHY AND VISUALIZATION II
Lesson 7
By Mwaura Joshua | @openmapsCo on Twitter
Lesson 7: Map design & map layouts
Map design & layouts | Factors influencing design
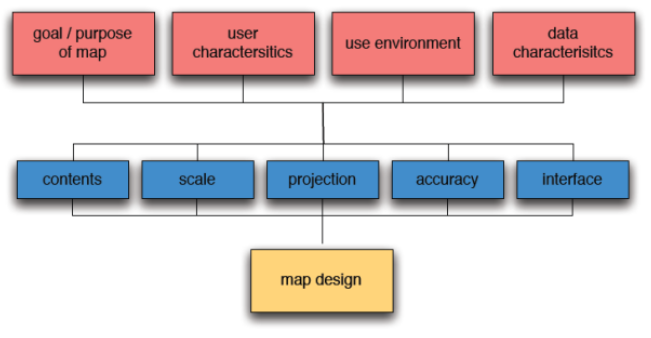
Factors | 1. Purpose of map use
- A map can be designed for different purposes for instance navigation/orientation, planning, maintenance, forecasting, monitoring, education
- Objectives influence types of symbols to be used to convey the main message of the map
- Maps are designed primarily for two purposes;
- a. Substantive objective
- This relates to the information a map is to include, for instance;
- General purpose maps are inherently multipurpose
- Thematic maps on the other hand are meant to focus on overall form
Factors | 1. Purpose of map use
- b. Affective objective
- This relates to the maps total look
- Affective objective concerns how this information is portrayed
- Should the map appear dark or light, crowded or open, precise or approximate?
- The affective objective also relates to the general subjective feeling to be conveyed, such as graceful, bold, classical or modern
- All design choices should match/reflect the map’s objective while also ensuring that its appearance is appealing to the user
Factors | 2. Map user characteristics
- Qualities of the audience for which the map is being designed for constraints map design
- For example qualities such as:
- Age of the user
- For instance how a map for children is designed will be different from that of professions. Use of attractive symbols and colours is expected to capture attention of children as compared to a thematic professional map who can extract a lot of information from abstract symbols
- Map reading experience
- During map design, it should be considered whether the intended audience have any map reading skills
- For instance, basic symbols that can be understood should be used for the audience with little map reading experience. Examples tourist maps are always designed with easy to understand symbols, like, use of a fork and plate to illustrate hotels/restaurant
Factors | 2. Map user characteristics
- Knowledge of the area or domain
- User may have some or no knowledge of the area or topic being addressed. Such issues may influence how much details should be included in the map
- Disability
- Disabilities of the map user, such as blind person should be considered. Brail maps for instance, is an appropriate design for blind people. Also other issues like colour blindness on the part of the user. In this case little use of colour should be made
Factors | 3. Map use environment
- Where the map will be used is a factor that influences the design process
- Cases;
- Hard copy maps
- e.g. wall map, desktop or field map. The materials used to design for example field maps should be resistance to wear and tear and have symbols like scale to allow measurements to be done
- Onscreen maps
- i.e. whether on desktop or mobile devices stand alone or on network applications are environment to be put into considerations
- Mobile maps
- maps size will be a great factor to consider since they are displayed on small touch screens
- maps should allow a user to make interactive queries via touch screen buttons
Factors | 4. Data characteristics
- To find proper symbology for a map, one has to analyze the cartographic data
- The core of this process of analysis is to access the characteristics of the data to find out how they can be visualized, so that the map user properly interprets them
- The first step in the analysis process is to find a common denominator for all the data
- The denominator will be used as the title of the map
- i.e. if the data is related to land-use collection of a certain year then the title then the title land-use and the year will be relevant to the map’s theme
Factors | 4. Data characteristics
- Data can also be qualitative or quantitative in nature
- Qualitative data
- also called nominal data exist as discrete named values without a natural order amongst the valuesi.e. names of places or different types of soil
- Quantitative data
- can be measured, either among an interval or a ratio scalei.e. income earnings or salaries of employees. These types of data are mapped differently
- Other characteristics of the data such as:
- can the data be grouped? or
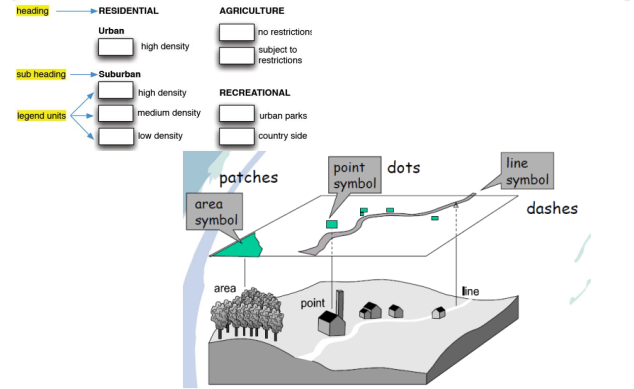
- what are the dimensions of features to be mapped?i.e. points, lines area or volume influence choice of symbols
Factors | 4. Data characteristics
Factors | 5. Technical limits
- In computer assisted cartography, technical limits include the capabilities of the software and hardware
- Available pen sizes, line widths and value and hue variations all constitute design constraints
- Various limits may be prescribed for a printed map;
- one color or several colors, hand drafted or scribed, printed or plotted under computer control
- Maps to be viewed on a web browser;
- where the resolution and bandwidth are limited
- Always be aware of all technical limits within which the map will be produced, at design stage
Factors | 6. Reality
- Every region has a certain geographical character (i.e.physical nature) over which the cartographer has little control
- For instance narrow countries like Chile, Somalia
- Some land forms are extremely rugged;
- soil varieties are often complex and areas of recent glaciations tend to have enormous number of lakes
- Nothing can be changed about these geographical realities
- The constraints of reality will sometimes make it hard for you to organize things hierarchically as one might like e.g. a color convention such as blue water may prevent color series one would like to use
Factors | 7. Scale of production
- Scale controls the quality of mapping. i.e., the number of information that can appear in a map frame
- For instance, if a small scale is to be used features will be fewer, smoother, combined or displaced (use of generalization)whereas it is vice versa for a larger scale
- The other elements {constrain to map design} such as
- contents of the map
- map projection system to be adopted
- expected accuracy of the map
- user interface (i.e. desktop or onscreen)
--End of Lecture 7--
Cartography & Visualization II
“Design is so simple, that’s why it is so complicated.” - Paul Rand, graphic designer
That’s it!
Queries about this lesson, please send them to:
***References***
- Mapping, Society, and Technology, Steven Manson
- Web Cartography, Map Design for Interactive and Mobile Devices, Ian Muehlenhaus
- Web Cartography, Menno-Jan Kraak and Allan Brown, ITC
- Cartography, Thematic Map Design, Borden D. Dent
- GIS Cartography, A Guide to Effective Map Design, Gretchen N. Peterson
- Thematic Cartography and Geovisualization, Terry A. Slocum et.al
Courtesy of reveal.js