Lecture 5: Mapping Quantitative data

Cartography & Visualization II

J.Mwaura

Choropleth Mapping

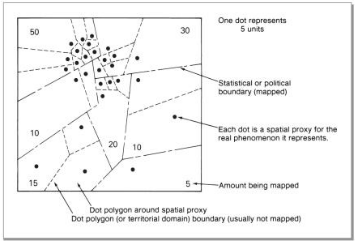
A method of cartographic representation which employs distinctive color or shading applied to areas other than those bounded by isolines. These are usually statistical or administrative areas(Meynen, 1973)

Depicts bounded areal classified or aggregated data (often defined by administrative areas), it is sometimes called enumeration mapping

  • countries, states, provinces, counties, census tracts or
  • any other unit that has associated attribute data that correspond to the enumeration units

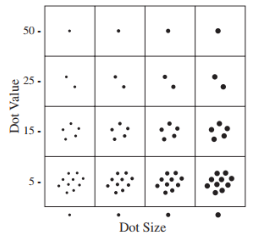
Major concerns of the cartographer are data classification, areal symbolization, & legend design

Choropleth Mapping

Map readers use choropleth maps in three ways;

  1. To obtain a sense of the overall geographical pattern of the mapped variable with attention to individual values
  2. To compare choropleth patterns
  3. To ascertain an actual value (or the class range) associated with a geographic area

Choropleth Mapping

Geographic phenomena such as population density, agricultural variables, education data, or other economic data lacks consistent across each enumeration area

  • If the level of variation is too great within enumeration units, a smaller enumeration unit level could be considered

The boundaries of the polygons or the individual enumeration units have no numerical values associated with them

  • They function only to separate the enumeration areas & signify the geographic extent to which the enclosed area values apply

Choropleth Mapping

Mapping rationale

  • A choropleth map is simply a planimetric representation of this 3D prism model.In the model the height of each prism is proportional to the value it represents
  • In color choropleth map production, darker or more saturated hues represent higher values, and lighter or less saturated represent lower values

Choropleth Mapping

Appropriateness of data

  • Choropleth maps are constructed when data is attributed to definite enumeration units that are areal in nature
  • Geographic phenomena that arecontinuous in nature should not be mapped by the choropleth technique because their distributions are not controlled by political or administrative subdivisions
  • If the data cannot be dealt with as ratios or proportionsthey should not be portrayed by the choropleth technique
  • Not used when the interest is only to show actual, precise values within enumeration units

Choropleth Mapping | Design Considerations

Geographic phenomenon and its elements

  • A careful designer assembles facts that will help in understanding the mapping activity
  • Observe the principle of know your data,always create graphs of your data

Map scale

  • Consider necessity & space availability
  • Purpose of a map should always help to balance on scale choice

Choropleth Mapping | Design Considerations

Number & kind of areal units

  • Spatial detail is depends with size and number of enumeration units
  • Choice of number of enumeration units depends on variables such astime, cost, map purpose, map size and scale, & symbolization

Data preparation & processing

  • Choropleth mapping requires that data be in derived form, such as ratio or rate
  • One common derivation is to divide a column containing the total data (such as total population values per county) by a column containing the areas of each enumeration unit

Choropleth Mapping | Design Considerations

Data classification

  • Understand your data characteristics - when selecting a classification method
  • Map purpose & audience should guide classification

Areal symbolization

  • Select symbolization to fill enumeration unit areas
  • You have to address the questions; Which symbolizationn scheme is effective?, With which media will it work?
  • To answer, You need to examine black and white (or grayscale) and color symbolization for the class ranges

Areal Symbolization Tips

Suggestions in choosing & adjusting colors

  • Make sure that there is enough differential between the symbolization in the class ranges
  • For virtual maps, understand that display monitor types and brands, their settings, and the graphics cards
  • For printed maps, then printing a color table of selected color ramps or other hue/value/saturation combinations is advised
  • Use ColorBrewer, to select color schemes - quantitative maps
  • Avoid using qualitative discrete color fills that are normally reserved for categorical data e.g., on a 4 class map, blue-yellow-red-green is a horrible sequence for choropleth maps

Legend Design

Box Shape, Size

  • When smaller enumeration units, the boxes are drawn at approximately the same size as an average size polygon
  • When larger enumeration units are used, the boxes are drawn at approximately half to one-third of the area of an average size polygon

Orientation

  • Vertical presentation is common, horizontal presentation is good where the map body has a longer east-west orientation

Range Placement

  • Class ranges labels for vertical are placed on right side, for horizontal, below the box
  • Legend boxes may represent data from lowest to highest classes in a vertical presentation or vice versa
  • For horizontal presentation, the boxes are placed from lowest to highest from left to right

Mapping quantitative data | Dot maps

Purpose - to communicate variation in spatial density

In simplest case,

  • The technique involves the selection of an appropriate point symbol to represent a quantity of a geographically distributed phenomenon
  • The symbol form (size, shape, color, and so on) does not change, but the frequency of dots changes from area to area in proportion to the number of objects being represented
  • The technique works best for data that are tabulated in enumeration areas as totals

Dot maps | Data Suitability

Totals or non-derived quantities. e.g., agricultural production data (such as crop productivity (in tons), numbers of livestock), and population totals

Data sets with extremely small or large data ranges are often more difficult to portray effectively with dot maps

  • Dot maps use a single number to represent the value of the dot
  • small/extremely large ranges will produce a uniform/non-uniform spatial distribution

Setting dot value & size are 2 crucial components of dot mapping

Dot Mapping

Most dot maps are constructed using small or intermediate scales

  • At these scales, attribute data are normally collected in tabular form for enumeration areas
  • Each dot represents more than one mapped element
dots

Dot Mapping | Dot value & size

Dot value & size affect the map reader's impression and understanding of the map

  • Dots that are too small don't always stand out as proper figures relative to the rest of the map
  • When dots are too large the map takes on a crude appearance, especially if the dot value is too low
dots

Dot Value & Size Selection Guidelines

  • Choose a dot value that results in 2 or 3 dots being placed in the statistical area that has the least mapped quantity
  • Choose a dot value & size such that the dots just begin to coalesce in the statistical area that has the highest density of the mapped value
  • Preferably select a dot value that is easily understood. E.g., 5, 500 and 1,000 are better than 8, 49, or 941

dots

End of Lecture 5

Cartography & Visualization II

That's it!

Queries about this Lesson, please send them to: jmwaura.uni@gmail.com

*References*

  • Mapping, Society, and Technology, Steven Manson
  • Web Cartography, Map Design for Interactive and Mobile Devices, Ian Muehlenhaus
  • Web Cartography, Menno-Jan Kraak and Allan Brown, ITC
  • Cartography, Thematic Map Design, Borden D. Dent
  • GIS Cartography, A Guide to Effective Map Design, Gretchen N. Peterson
  • Thematic Cartography and Geovisualization, Terry A. Slocum et.al
Courtesy of
Cartography & Visualization II