The visual thinking/visual communication curve referred to as "swoopy" - DiBiase (1990)
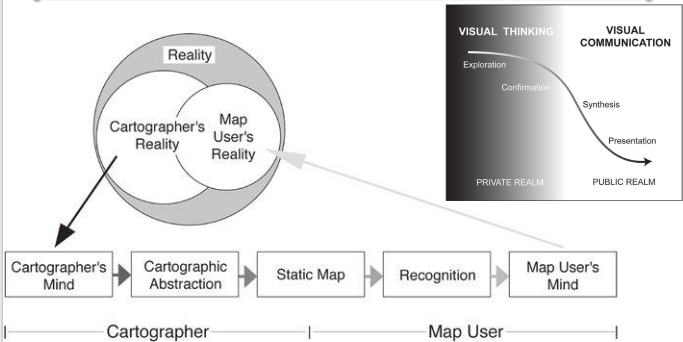
The visual thinking/visual communication curve referred to as "swoopy" - DiBiase (1990)
Refers to the steps for designing maps;
1. Define meaning & purpose of the map
Understand the user requirementsDetermine details to be communicatedDecide on best to communicate the ideasCreate a narrative for the map2. Choose a suitable scale
Map scale continuum - large scale to a small scaleLarge scale 1:0 upto 1:600,000Medium scale 1:600,001 upto 1:2,000,000Small scale 1:2,000,001 upto infinityAmount of detail mapped depends on scaleIt's an important decision to most cartographers3. Determine the map format, printing limitations, & economics of reproduction of the map product
What kind of a map?What type of a map?How will the map be displayed?How much will it cost to create the map?4. Data preparation - by abstraction and generalisation
Only potentially important information is importantCartographers select & organize information necessary to
communicate concept to map readerCartographers reduce the amount of detail on a map to create a
simple visual image5. Design the map layout
Carefully consider the placement and design of the 12 map
elements
Consider the scale, size, and shape of the primary object being
mappedQueries about this Lesson, please send them to:
*References*
- Mapping, Society, and Technology,
Steven Manson- Web Cartography, Map Design for Interactive and Mobile Devices,
Ian Muehlenhaus- Web Cartography,
Menno-Jan Kraak and Allan Brown, ITC- Cartography, Thematic Map Design,
Borden D. Dent- GIS Cartography, A Guide to Effective Map Design,
Gretchen N. Peterson- Thematic Cartography and Geovisualization,
Terry A. Slocum et.al