Lecture 3: Thematic Mapping & Measurement Levels

Cartography & Visualization II

J.Mwaura

Measurement Scales

S. S. Stevens, said that measurement is the assignment of numerals to things so as to represent facts and conventions about them. Measurement is an attempt to structure observations about reality

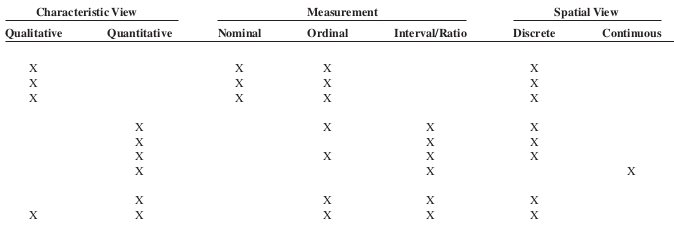
Measurement levels listed by order of sophistication;

  • Nominal-Latin for name only (Republican, Democrat, Green)
  • Ordinal-Think ordered levels or ranks (small-8, medium-12, large-32)
  • Interval-Equal intervals among levels (1 KSh to 2 KSh is the same interval as 88 KSh to 89 KSh)
  • Ratio-Let the "o" in ratio remind you of a zero in the scale

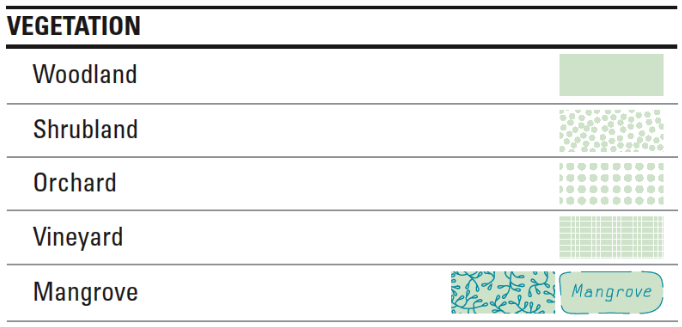
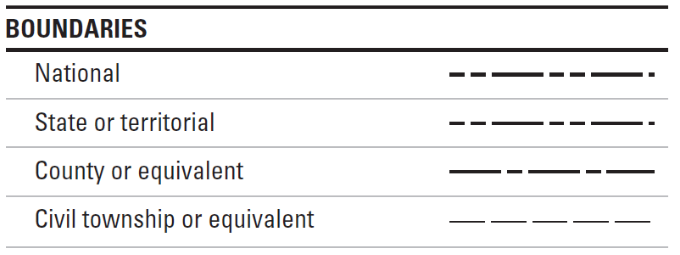
Importance of measurement scales

  • helps to choose the symbolization methods
  • identify the thematic map type

Measurement Scale | Nominal

Nominal level data are data that are denoted with different names (e.g., forest, water, cultivated, wetlands), or categories

Data produced by assigning observations into unranked categories are nominal level measurements

Nominal data are a type of categorical (qualitative) data

themes

Measurement Scale | Ordinal

This level depicts ordered relationship among the variable's observations. It assigns observations to discrete categories

Prioritizing nominal categories transforms nominal level measurements to the ordinal level

Because the categories are not based upon a numerical value (just an indication of an order or importance), ordinal data are also considered to be categorical (or qualitative)

themes

Measurement Scale | Interval

Interval level data are numerical (quantitative)

Examples of interval level data include temperature and year

  • With interval level data, the zero point is arbitrary on the measurement scale
  • For instance, zero degrees Fahrenheit and zero degrees Celsius are different temperatures
  • Good for geographical analysis, allows statistical tests
themes

Measurement Scale | Ratio

Ratio level data are also numerical (quantitative)

The zero is true for ratio level data

  • For example, zero meters and zero feet mean exactly the same thing
  • Ratio level data allows mathematical operations on the data
  • Good for geographical analysis, allows statistical tests
themes

Importance Measurement Levels

Different analytical operations are possible with data at different levels of measurement. Common operations;

  • Group: Categories of nominal and ordinal data can be grouped into fewer categories
  • Isolate: One or more categories of nominal, ordinal, interval, or ratio data can be selected, and others set aside
  • Difference: The difference of two interval-level observations (such as two calendar years) can result in one ratio level observation (such as one age)
  • Other arithmetic operations: Two or more compatible sets of interval or ratio level data can be added or subtracted. Only ratio level data can be multiplied or divided

Read more

Data & Thematic Map Relationships

themes

Thematic Mapping | Visual Variables

  • Size -used to imply relative levels of importance. Proportional symbols are used where the size of the geometric form is scaled proportionally to the data
  • Shape -to facilitate external identification, through shape symbolization
  • Orientation -orientation of symbols of other structures to mimic reality
  • Texture -used in the area symbolization to communicate the nature of a landscape
  • Saturation -is level of brightness of the color/hue. Shows importance
  • Value -is the sequence of steps between light and dark. Shows importance

Thematic Mapping | Visual Variables

themes

Thematic Mapping | Visual Variables

Complexity of maps symbols results from the nature and characteristics of the data

themes

Thematic Mapping | Visual Variables

Complexity of maps symbols results from the nature and characteristics of the data

themes themes

Thematic Mapping | Visual Variables

Complexity of maps symbols results from the nature and characteristics of the data

themes themes

End of Lecture 3

Cartography & Visualization II

That's it!

Queries about this Lesson, please send them to: jmwaura.uni@gmail.com

*References*

  • Mapping, Society, and Technology, Steven Manson
  • Web Cartography, Map Design for Interactive and Mobile Devices, Ian Muehlenhaus
  • Web Cartography, Menno-Jan Kraak and Allan Brown, ITC
  • Cartography, Thematic Map Design, Borden D. Dent
  • GIS Cartography, A Guide to Effective Map Design, Gretchen N. Peterson
  • Thematic Cartography and Geovisualization, Terry A. Slocum et.al
Courtesy of
Cartography & Visualization II