CARTOGRAPHY AND VISUALIZATION I
Lesson 6
By Mwaura Joshua | @openmapsCo on Twitter
Lesson 6: Cartographic Animation
Mapping Change
- Mapping the time dimension means mapping change and this can refer to change in a feature’s existence, such as appearance or disappearance
- Animaps
Mapping Change
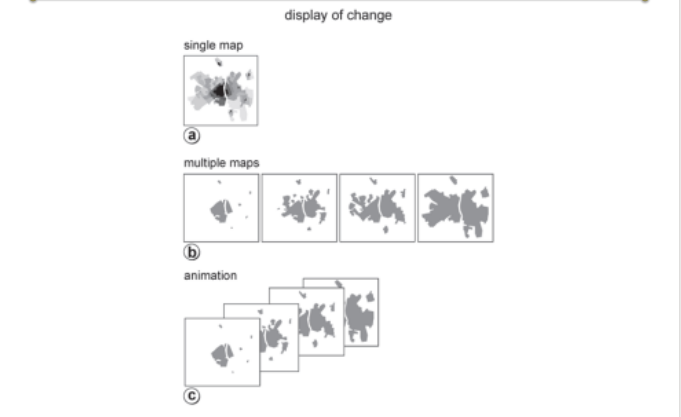
Cartographic Animation | Temporal animation
- When dealing with a temporal animation, a direct relation exists between display time and world time
- An animation’s temporal scale would be the ration between display time and world time
- Time units, the animations temporal resolution, can be seconds, years or millennia
Cartographic Animation | Temporal animation
- The GIS environment also distinguishes another type of time, i.e. database time
- Temporal animations show changes in the locational or attribute components of spatial data
- It is important that the user can influence the flow of the animation
- Minimum functionalityto play with the timeline: forward, backwards, slow, fast, pause
Cartographic Animation | Non-temporal animation
- Display time in non-temporal animations is not directly linked with world time
- The dynamics of the map are used to show spatial relationships or to clarify geometrical or attribute characteristics of spatial phenomena
- Here interaction is necessary as well to allow the user to answer the question ‘How was it?’
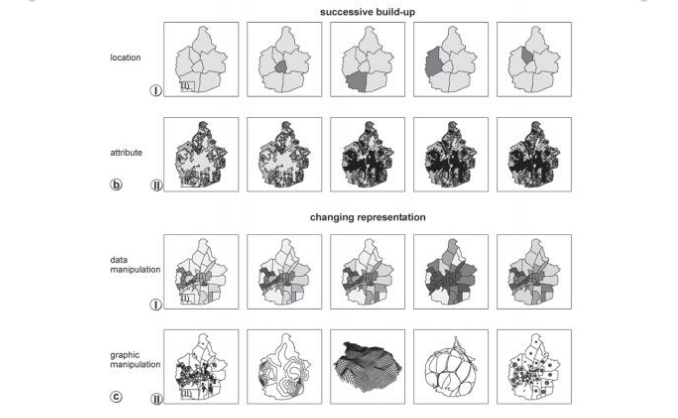
- Non-temporal animations can be split into those;
- displaying a successive build-up of phenomena
- showing changing representations of the same phenomena
Cartographic Animation | Non-temporal animation
- Examples of animations with successive build-up include the following;
- Understanding a three-dimensional landscape. For instance, first only the terrain is displayed, followed later by the addition of other themes such as roads, land use and hydrography (location)
- In thematic mapping alternating classes are highlighted to show, for instance, the distribution of low and high values (attributes)
Cartographic Animation | Non-temporal animation
- Examples of animations with changing representations (rendering different data or rendering the same data according to different map types), include the following;
- a display of choropleths with different classification methods used (attribute)
- maps with blinking symbols to attract attention to certain map objects, object categories or their attributes
- a simulated flight through the landscape, as a result of continuous changes in the viewpoint of the user (location)
- the effects of panning and zooming in or out in animation (location and attribute)
Cartographic Animation
Cartographic Animation | Vehicular navigation
- Animation along a route;
- Google maps navigation
Try out...
- Using web maps, create an animated map showing the cycling from point A to point B
- Expert systems
---End of Course---
That’s it!
Queries about this Lesson, please send them to:
***References***
- Mapping, Society, and Technology, Steven Manson
- Web Cartography, Map Design for Interactive and Mobile Devices, Ian Muehlenhaus
- Web Cartography, Menno-Jan Kraak and Allan Brown, ITC
- Cartography, Thematic Map Design, Borden D. Dent
- GIS Cartography, A Guide to Effective Map Design, Gretchen N. Peterson
- Thematic Cartography and Geovisualization, Terry A. Slocum et.al
Courtesy of reveal.js