CARTOGRAPHY AND VISUALIZATION I
Lesson 3
By Mwaura Joshua | @openmapsCo on Twitter
Lesson 3: Static Mapping
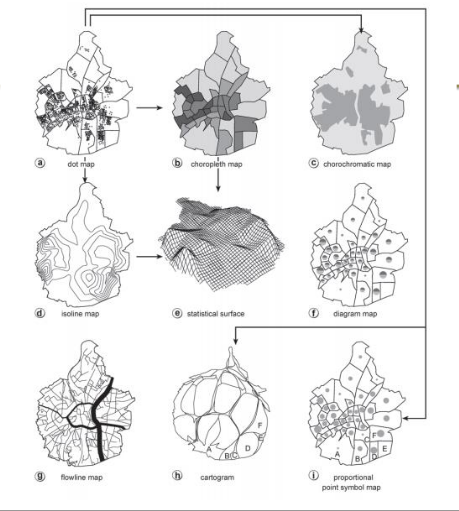
Static Mapping | Choropleth maps
- Choropleth technique is defined by the International Cartographic Association as follows;
- A method of cartographic representation which employs distinctive color or shading applied to areas other than those bounded by isolines. These are usually statistical or administrative areas(Meynen 1973)
- A form of mapping is used to depict , bounded areal classified or aggregated data (often defined by administrative areas), it's also called enumeration mapping
- Cartographer's major concerns; data classification, areal symbolization, & legend design
Static Mapping | Choropleth maps
- Examples of typical enumeration units used in choropleth maps include;
- countries, states, provinces, counties, census tracts, or any other unit that has associated attribute data that correspond to the enumeration units
Static Mapping | Choropleth maps
- Map readers use choropleth maps in three ways:
- to obtain a sense of the overall geographical pattern of the mapped variable with attention to individual values
- to compare one choropleth map pattern to another
- to ascertain an actual value (or the class range) associated with a geographic area
Static Mapping | Chorochromatic maps
- Depicts a wide variety of nominal or discrete data
- Discrete field is a property that varies over space, theoretically having a measurable value at any location
- However, the value in this case is nominal or categorical, and due to the typical presence of Tobler's First law of geography, there are usually regions of constant value which makes discrete values represent features that have definite boundaries in Chorochromatic maps
- Discrete data can only take some values and these ones can be counted but not measured, which make it easy to categorize it into classifications
Static Mapping | Chorochromatic maps
- Examples of discrete fields that are commonly depicted using chorochromatic maps include:
- Climate classification
- Dominant vegetation species or eco-zones
- Predominant language, religion, ethnicity
- Soil type
- Surface geologic strata e.t.c
- In chorochromatic maps, the regions are drawn based on detailed locational data
Static Mapping | Graphs and Diagrams
- Display information on static maps using;
- Tables
- Graphs
- Histograms
- Diagrams
- Pie-charts
- Text
Static Mapping | Dot maps
- Purpose;
- To communicate variation in spatial density
- Quantitative maps;
- whereby information pertaining to density and distribution is gained by visual inspection of the spatially arrayed symbols to arrive at relative magnitudes
Static Mapping | Dot maps
- In simple case,
- the technique involves the selection of an appropriate point symbol to represent a quantity of a geographically distributed phenomenon
- The symbol form (size, shape, color, and so on) does not change, but the frequency of dots changes from area to area in proportion to the number of objects being represented
- The technique works best for data that are tabulated in enumeration areas as totalsand has been used extensively for mapping agricultural production data and population data
Dot maps | Data Suitability
- Totals or non-derived quantities are used in dot mapping. Thus, derived or ratio data, should be avoided for this technique
- e.g. agricultural production data (such as crops, crop productivity (in tons), numbers of livestock or farms), and population totals
- Density is visually inferred by the distribution of the dots instead of by using derived tabulated data
- Data sets with extremely small or large attribute data ranges are often more difficult to portray effectively with dot maps
- Dot maps use a single number to represent the value of the dot. Thua, data with small attribute ranges will produce a uniform spatial distribution
- Data with extremely large attribute ranges make setting a dot value and dot size that is visually satisfactory for both highest and lowest density areas of the map quite difficult
- Setting dot value & size are crucial steps of dot mapping
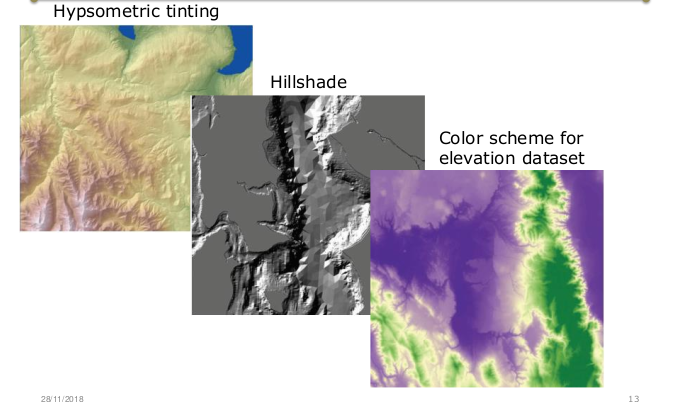
Static Mapping | 3-D Visualization
- 3-D visualization can be displayed in many different ways, such as hillshade (also called relief representation)
- Other options for displaying elevation include;
- contouring with or without hypsometric tinting (shaded contour map or shaded isoline map),
- Brown for above-sea-level elevations (except over glaciers, they are blue)
- Blue for below-sea-level elevations
- Spot height labels,
- 3D oblique effect
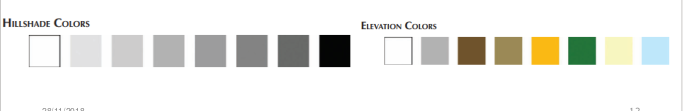
3-D Visualization | Elevation & Hillshade
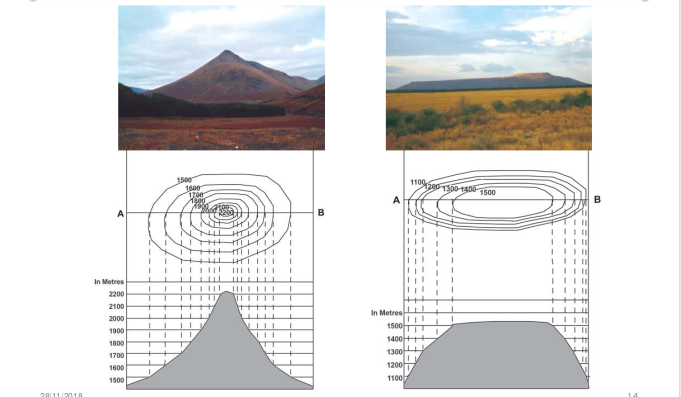
3-D Visualization | Representation & interpretation
--- End of Lesson 3---
That’s it!
Queries about this Lesson, please send them to:
***References***
- Mapping, Society, and Technology, Steven Manson
- Web Cartography, Map Design for Interactive and Mobile Devices, Ian Muehlenhaus
- Web Cartography, Menno-Jan Kraak and Allan Brown, ITC
- Cartography, Thematic Map Design, Borden D. Dent
- GIS Cartography, A Guide to Effective Map Design, Gretchen N. Peterson
- Thematic Cartography and Geovisualization, Terry A. Slocum et.al
Courtesy of reveal.js