CARTOGRAPHY AND VISUALIZATION I
Lesson 2
By Mwaura Joshua | @openmapsCo on Twitter
Lesson 2: Visualization in GIS
Visualization in GIS | Introduction
- Visualization is a technique for creating images, diagrams, or animations to communicate
- Since the dawn of man , visualization through visual imagery has been an effective way to communicate both abstract and concrete ideas
- Map remains a traditional medium geographic visualisation
- Geo-visualization interactive visualization, using a set of tools and techniques that supports geospatial data analysis
Components of Visualization
- Visualization depends on the interaction of:
- Database - store information
- Display - visualisation medium
- Human visual system - reception
- Brain - process information
Cartographic Communication Concepts
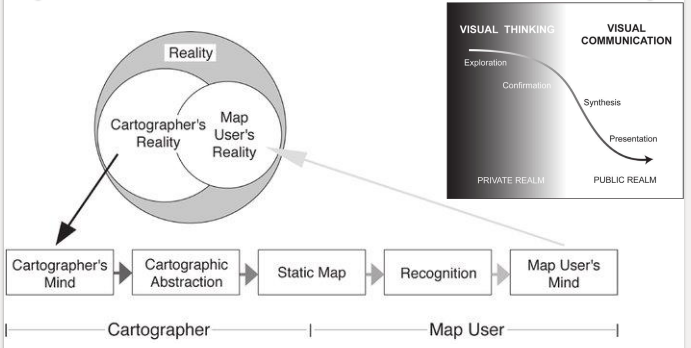
- Cartographic Communication Model
- The visual thinking/visual communication curve referred to as "swoopy" from DiBiase (1990)
Visualization | Cartographic Process
- Recommended series of steps you should follow to design a map {unmapped data to map form}
- Define the purpose and meaning of the map;
- interpret the requirements of the user
- determine what needs to be communicated
- determine how to best facilitate communication of your ideas, and create a narrative for the map
- Choose the scale for the map
- the map scale is the ratio of the map distance to the earth distance
- map scale operates along a continuum from a large scale to a small scale
- Large scale [1:0 <> 1:600,000], medium scale [1:600,001 <>1:2,000,000], & small scale [1:2,000,001 <> ∞]
- the amount of detail you can show a map is directly dependent upon scale, the selection of map scale is possibly the most important decision a cartographer makes
Visualization | Cartographic Process
- Determine the map format, printing limitations, and economics of reproduction of the map product
- What kind of a map?
- What type of a map?
- How will the map be displayed?
- How much will it cost to create the map?
- Abstract and generalize the data to prepare it for placement on the map
- Only information that is potentially meaningful to the context should be included
- Cartographers select & organize information necessary to communicate concept to map reader
- Cartographers reduce the amount of detail on a map to create a simple visual image
Visualization | Cartographic Process
- Abstraction & generalization methods
- Selection
- Classification
- Simplification
- Symbolization-Use recommended conventions
- Design the map layout
- Carefully consider the placement and design of the 12 map elements
- Consider the scale, size, and shape of the primary object being mapped
Visualization | Abstraction & Generalisation
- Each operation results in a reduction of the amount of specific detail, yet the end result presents the map reader with enough information
- On the other hand, excessive generalization may lead to no transfer of knowledge
- A balance must be struck by the cartographer
Visualization | Cartographic Generalisation
- Types of cartographic generalization
- graphic & conceptual
- Graphic generalization is characterized by;
- simplification, enlargement, displacement, merging and selection
- maintains symbology
- affects geometric component of geospatial data
- Conceptual generalization is characterized by;
- merging, selection, symbolization and enhancement
- symbology may change
- affects attribute component of geospatial data
Visualization | Cartographic Generalisation
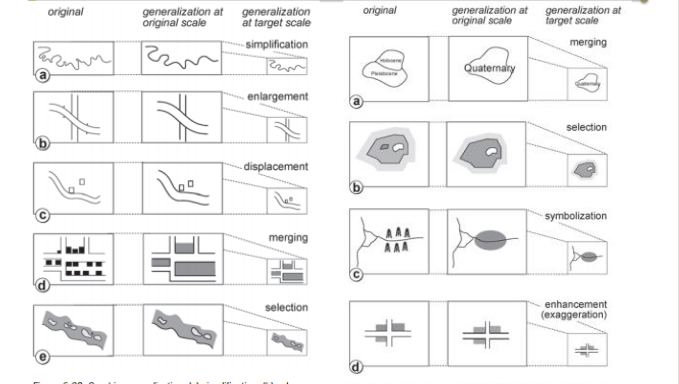
- left: Graphic generalization right: Conceptual generalization
Generalization | Selection
- Selection involves early decisions on;
- geographic space to be mapped
- map scale, map projection
- which data variables are appropriate for the map’s purpose
- sampling methods to be employed
- selection requires the cartographer to be familiar with the map’s content, nature of the data to be mapped
Generalization | Classification
- Classification refers grouping of identical or similar features to enhances communication
- Individuality and detail of each element is lost
- reduces the complexity of the map image
- helps to organize the mapped information
- In thematic mapping, classification can be carried out with qualitative or quantitative information
Generalization | Simplification
- Selection and classification are examples of simplification, but simplification may take other forms as well
- e.g. smoothing of natural or man-made lines on the map to eliminate unnecessary detail
- purpose of this map is simply to show connectivity between two points, not to illustrate the road’s precise locational features
Generalization | Symbolization
- In mapping, symbolization is required because its not possible to create a reduced image of the real world without devising a set of symbols that stand for real-world things
- Two major classes of symbols are used for thematic maps;
- Replicative
- designed to look like their real-world counterparts
- they are used to stand only for tangible objects
- basemap symbols are usually replicative in nature
- Abstract
- take the form of geometric shapes, such as circles, squares, and triangles
- Symbolization process is shaped by the influence of scale
Generalization | Read on
- The human vision system:
- vision
- perception
- cognition
- behaviour
--- End of Lesson 2---
That’s it!
Queries about this Lesson, please send them to:
***References***
- Mapping, Society, and Technology, Steven Manson
- Web Cartography, Map Design for Interactive and Mobile Devices, Ian Muehlenhaus
- Web Cartography, Menno-Jan Kraak and Allan Brown, ITC
- Cartography, Thematic Map Design, Borden D. Dent
- GIS Cartography, A Guide to Effective Map Design, Gretchen N. Peterson
- Thematic Cartography and Geovisualization, Terry A. Slocum et.al
Courtesy of reveal.js