A topographic map is a detailed and accurate graphic representation of cultural & natural features on the ground
Find out the how to?
A topographic map is a detailed and accurate graphic representation of cultural & natural features on the ground
Find out the how to?
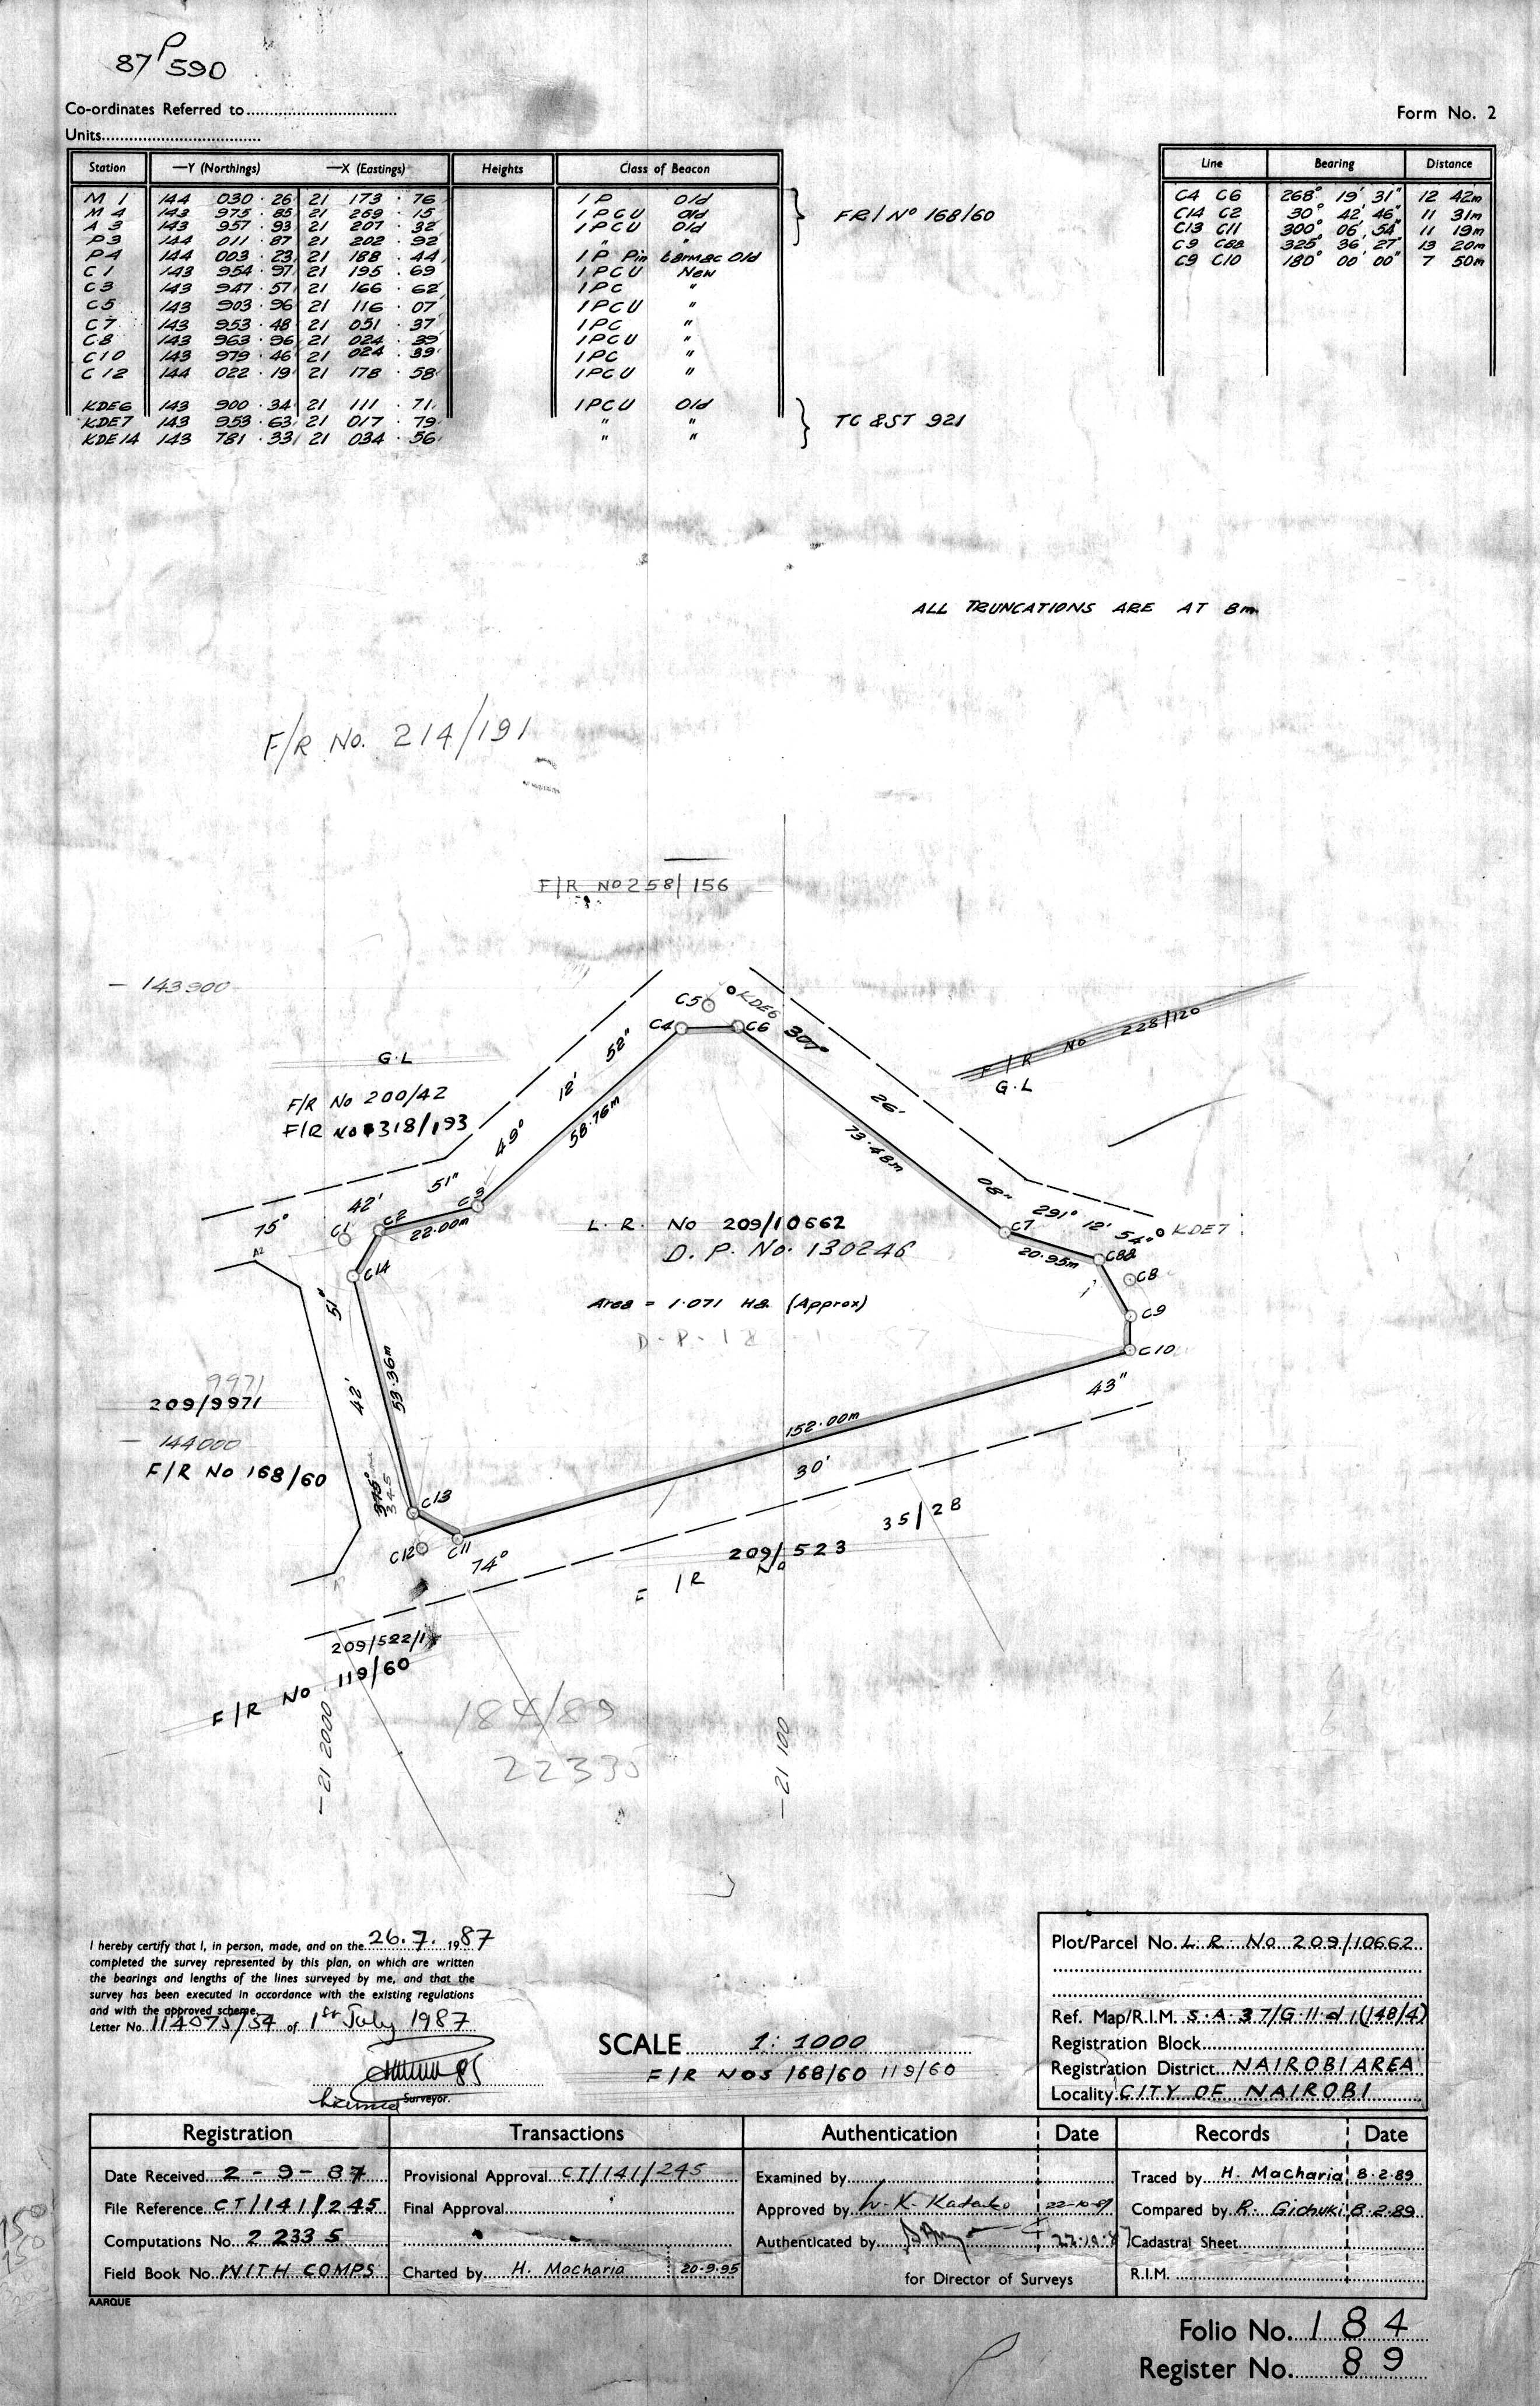
For property rights registration
Find out the how to?
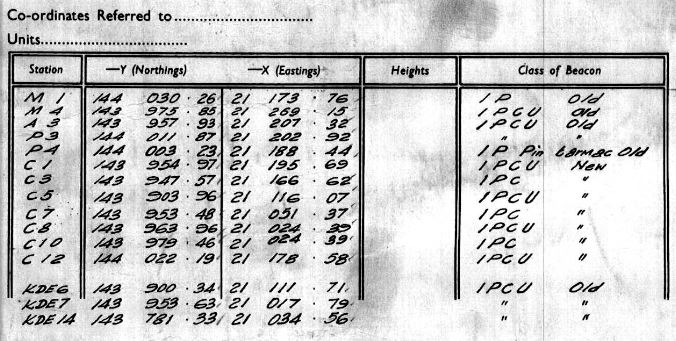
Reference to all survey works
Find out the how to?
Reference to all survey works
Find out the how to?
A representation of data that involves a manipulation of sorts to geographic space
Find out the how to?
Areal data representations
1. Qualitative areal mapping - chorochromatic maps
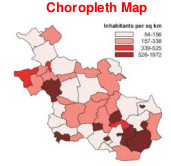
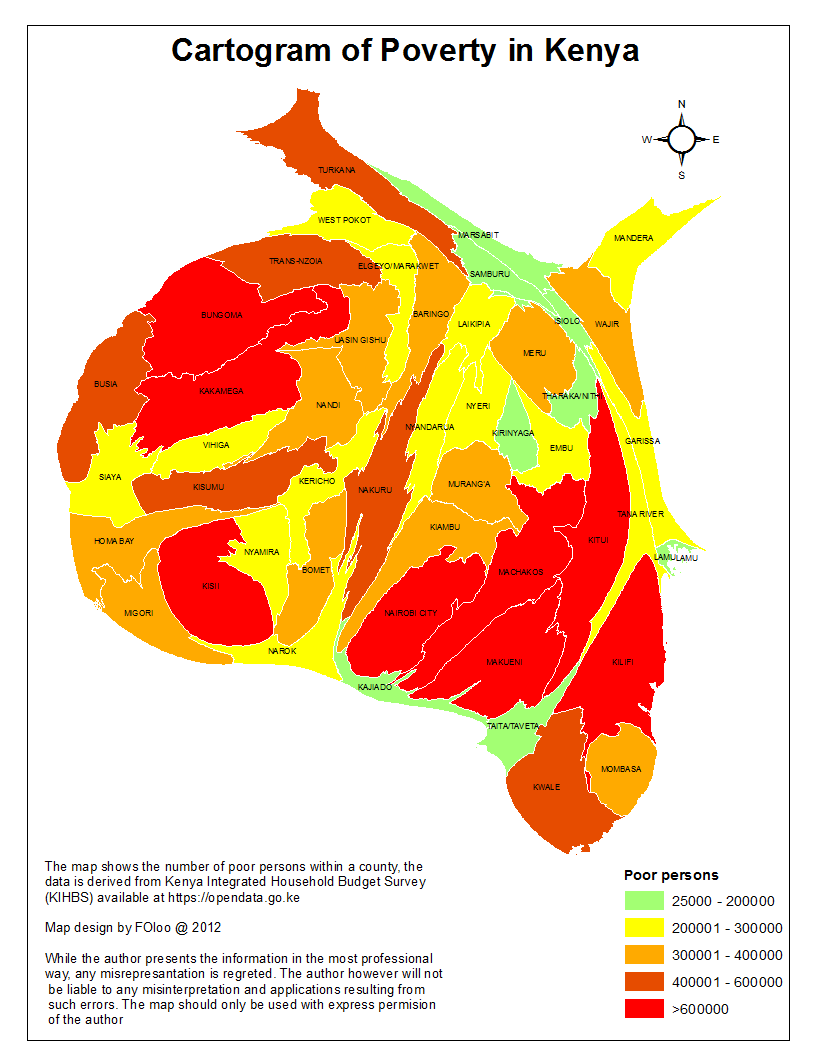
2. Quantitative mapping - choropleth maps
Find out the how to?
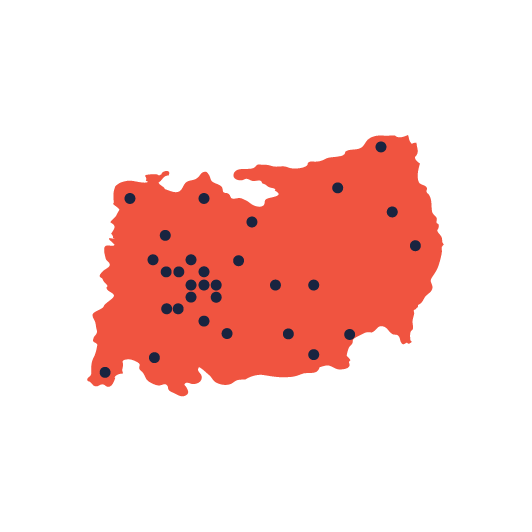
Statistical mapping
1. Dot density map
2. Dot map
Find out the how to?
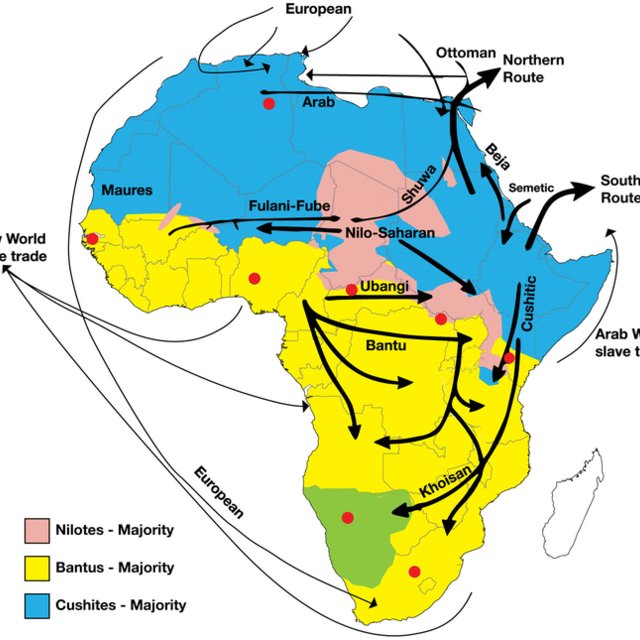
Flow map are a type of thematic map used in cartography to show the movement of objects between different areas
A flow map uses linear symbols to represent movement
These movements icludes; people, highway traffic, trade goods, water, ideas, data etc.
Find out the how to?
To find the proper symbology for a map, one has to execute a cartographic data analysis
Data will be of a qualitative or quantitative nature
Information about qualities; information that can't actually be measured. Deals with descriptions. Data can beobserved but not measured. Examples
The application of colour would be the best solution
The colours used have to be of equal visual weight or brightness
Each of the elements should get equal attention, and none should stand out above the others

Deals with numbers. Data which can be measured and ranked. Examples
We use two types of quantitative data in the realm of GIS
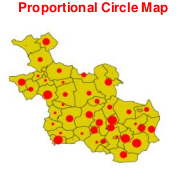
Absolute quantitative data describe intrinsic characteristic of the feature being measured
To map absolute quantitative data the symbols used should have quantitative perception properties
Symbols varying in size with varying in quantity
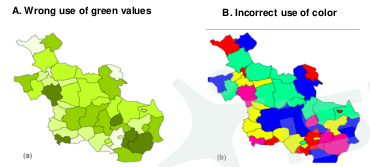
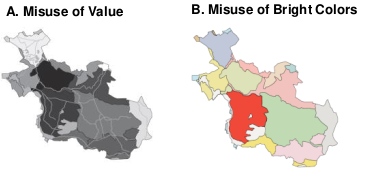
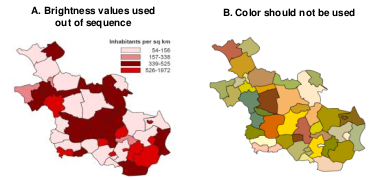
Relative quantitative data is data related to geographic distributions
The size of the geographic unit will influence the perceptional properties too much
The numbers now have a clear relation with the area they represent
Value(brightness) is the best method of mapping Relative quantitative data
Queries about this Lesson, please send them to:
*References*
- Analytical and Computer Cartography, 2nd ed.
Keith C. Claike- Geographic Information Systems: The Microcomputer and Modern Cartography, 1st ed.
Fraser Taylor
Courtesy of Open School