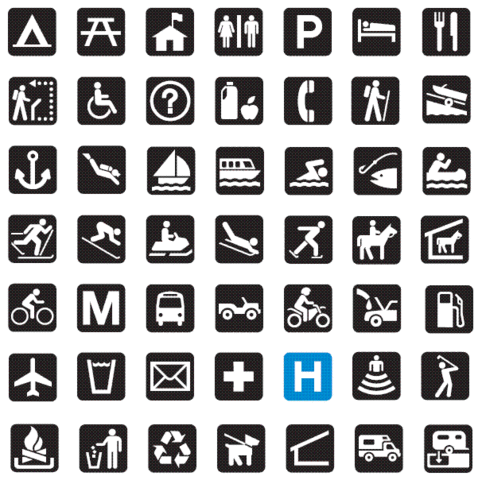
Iconic/image symbols have a similar appearance to the real-world feature, although it is often in a generalized form
Iconic/image symbols have a similar appearance to the real-world feature, although it is often in a generalized form
source: wikipedia
source: wikipedia
Maps
Statistics
Graphs
Reports
Easy to;
Prints
Projections
Web
Using Adobe illustrator, design a pictorial symbol of your choice in .png, .jpeg, .svg formats
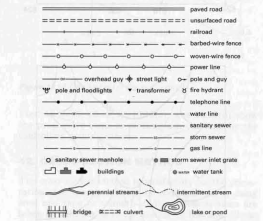
Topographic maps provide a plan view of a portion of the earth's surface showing natural & physical features such as rivers, lakes, roads, buildings, etc.
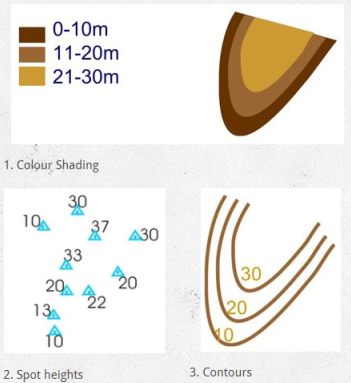
In topographic mapping, the shape or relief, of the area is shown by contour lines, spot heights, color shading
Topographic/Contour maps is the start-point of all planning before construction
Good knowledge of topography should precede the planning of highways, subdivisions, shopping centers, airports, golf courses, and other improvements
Topographic surveys are done to determine the relative positions of points & objects so that the cartographer can accurately represent their positions on the map
Types
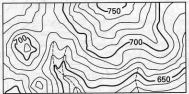
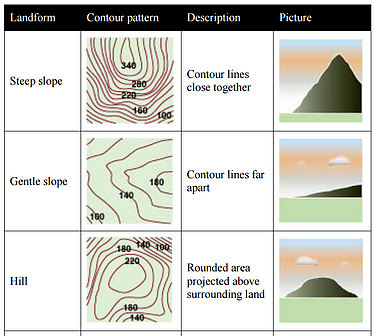
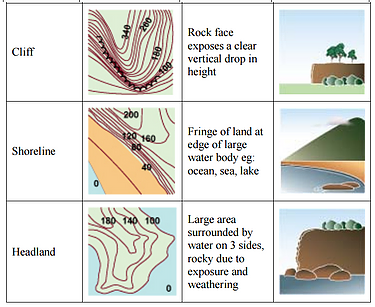
A contour is an imaginary line on the earth's surface that connects points of equal elevation
A contour line is a line on a map that represents a contour on the ground
In a topographic map, every 5th contour line - "index contour" may be darker and the elevation of that contour line is written in a break in the line
Contour interval of a map, is a vertical distance between contour lines
Choice of interval depends on character of terrain, purpose & scale of map e.g. in flat county - 0.5m, in mountainous county - 50m
The more accurate the contours, the more costly the map
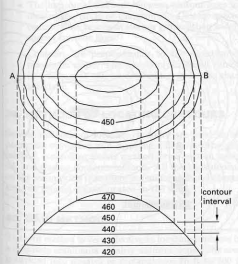
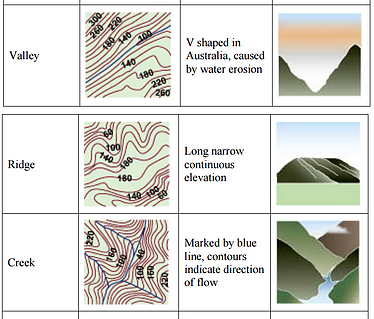
Contour lines that are closed represent either a hill or depression
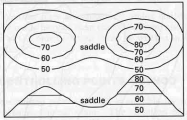
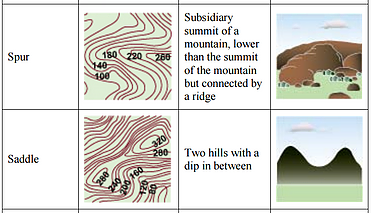
elevations increase as the contour lines become shortershort hachures on the down slope side of the contour lineA saddle is given to the shape of contours that define two summits in the same vicinity
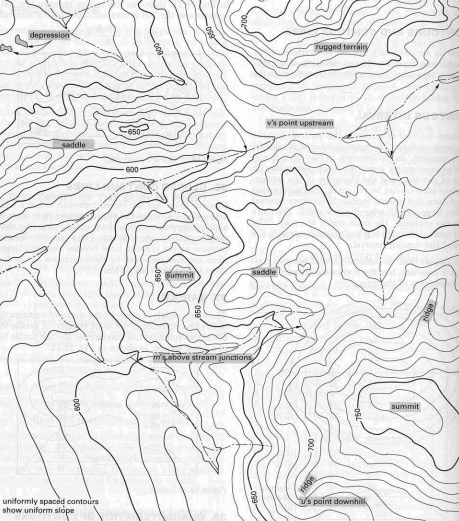
V's that point upstreamU's that point down the ridgeM's just above stream junctionsslope of the groundSeveral methods of locating contours are used in topographic surveying and mapping
All methods except coordinate method depend on the assumption that there is a uniform slope between any two ground points located in the field
First step of preparing a map
Assignment: Plot contours by grid method, tracing method, coordinate method by hand & computer
Queries about this Lesson, please send them to:
*References*
- Analytical and Computer Cartography, 2nd ed.
Keith C. Claike- Geographic Information Systems: The Microcomputer and Modern Cartography, 1st ed.
Fraser Taylor
Courtesy of Open School