Working with Raster Data; Georeferencing
Preparing Spatial & Tabular Data
Working with XY coordinate data; Mapping of Disease
Mapping Multiple Indicators
Mapping Program Coverage
Proximity Analysis; Buffers
Working with Raster Data; Georeferencing
Preparing Spatial & Tabular Data
Working with XY coordinate data; Mapping of Disease
Mapping Multiple Indicators
Mapping Program Coverage
Proximity Analysis; Buffers
Lets do this!
Georeferencing means to associate something with locations in physical space
In GIS, it is the process of associating a physical map, or a raster image of a map, with spatial locations (coordinates) so that the raster data can be viewed, queried, and analyzed with other geographic data, or used to create geographic data.
Under this topic, we shall work on;
Search for an area of interest in Google Earth
Create control points and save as a .kml file
Launch QGIS
In QGIS, georeferencing is accomplished using an external plugin called Georeferencer
In order to activate the Georeferencer plugin, select Plugins > Manage and Install Plugins from the QGIS main menu

Close the Plugins window
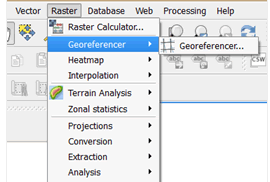
To open the Georeferencer tool, click on the main menu and select Raster > Georeferencer
Add the ungeoreferenced image
Process the data in a format that can be used in QGIS
Import the data into QGIS
Join (link) the data to administrative boundaries
Map population variation using the most and least method
Choose a classification scheme
Present results in a QGIS map layout
Join Attribute Tables toolCreate a choropleth map of feature (numeric data) variance
Spatial information is communicated to external audiences either in the form of printed or digital maps.Additional data may be required
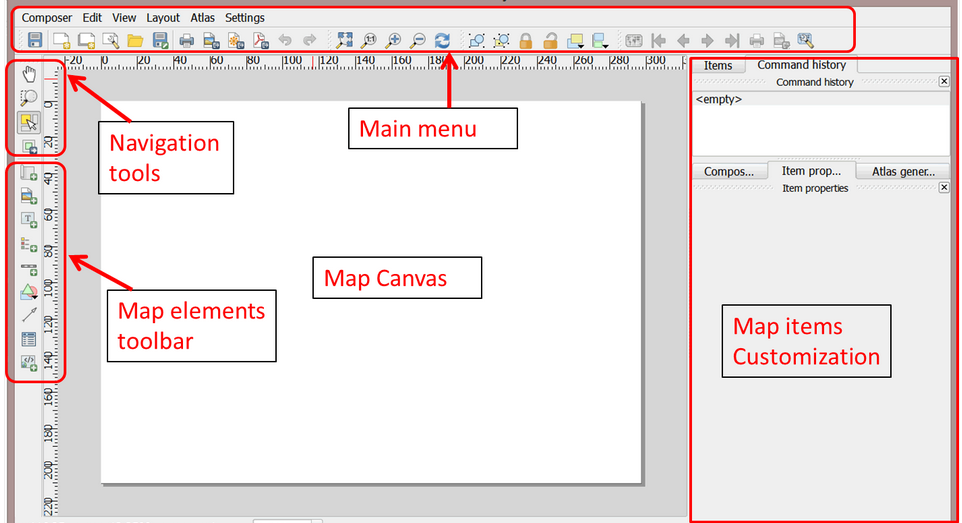
To create a map, click on the Print Composer button on the main menu.
Add X,Y coordinate data
Change coordinate systems
Perform spatial joins with summary statistics
Dissolve data
This is achieved by displaying one variable as a choropleth map and the second variable as a chart or diagram
Map program data using proportional symbols
Determining catchment areas or the geographic area covered by a facility or programs
Understanding all of the intervention points within a defined geographic area allows program planners to improve allocative efficiency and reduce duplication of efforts

Science of Where, for Why