Download data from GPS Essentials
Import data in QGIS
Query Data in QGIS
Prevalence rate Mapping
Download data from GPS Essentials
Import data in QGIS
Query Data in QGIS
Prevalence rate Mapping
Lets do this!
1. From the main menu, select Waypoints. It will show you the list of waypoints you recorded
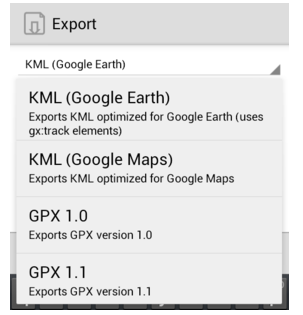
2. To export all the waypoints, select Export from the Options button. If you want to export a single waypoint, select the desired waypoint, click the Options button and select Export.
3. The dropdown box will let you select what type of file you want your data to be exported. For now, click KML (Google Earth)
Step 1 through 3
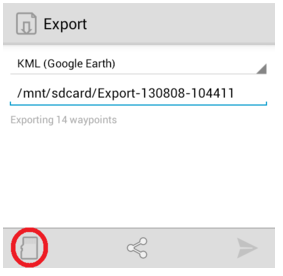
Step 4 & 5
4. Select the SD card icon to manually select your desired location of the file.
5. Click this icon to Save.
There are many different types of data sources you can import into QGIS
But, commonly used data types including shapefiles (.shp), csv files, & raster files
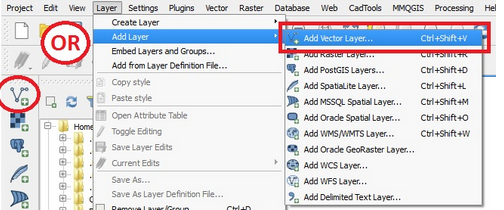
QGIS supported formats1. Click on the Layer menu, mouse-over Add Layer and click Add Vector Layer... You can also click the Add Vector Layer button in the left hand column of QGIS.
2. If the shapefiles you have are on your local machine, all you need to do is click on the Browse button and navigate to the folder where your shapefiles are

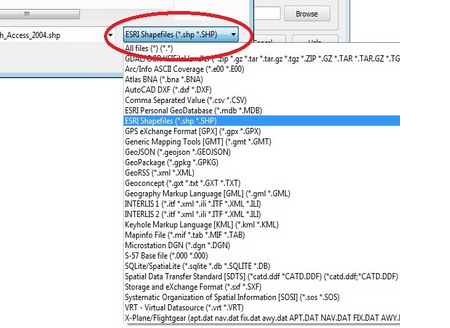
3. After you find the folder with your shapefiles, you will need to be sure the data type is selected to shapefile. Click on the drop-down box next to file name and select ESRI Shapefiles (.shp *SHP). You have many different vector data types to choose from if you have another data type. Click Open.
Once the csv files are formatted properly, you can add them into QGIS
1. Click on the Layer menu, mouse-over Add Layer and click on Add Delimited Text Layer... or click on the Add Delimited Text Layer icon in the left column of QGIS.
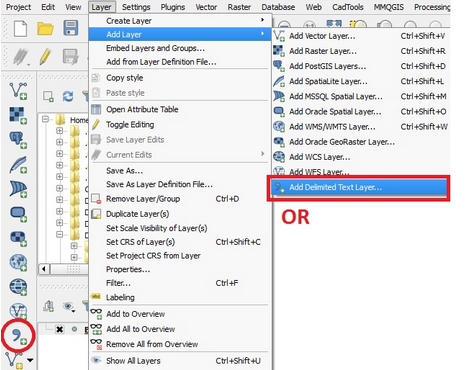
2. The next GUI will have many different options you may need to change depending on the specific data set you have. Here is an outline of the most common fields needed to be changed.
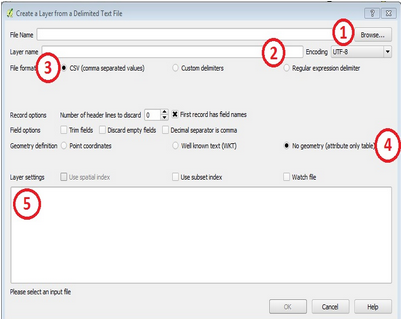
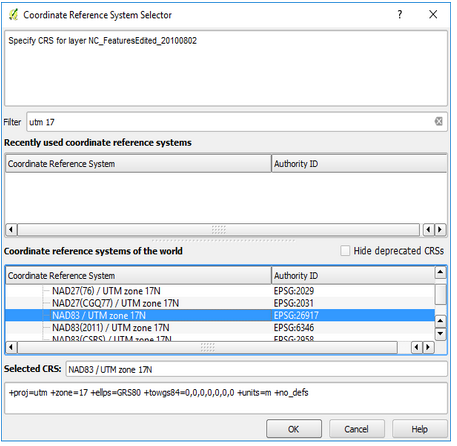
3. If you have a field with x, y coordinates, you may be prompted to define the coordinate reference system (CRS) of your x, y coordinates. For Kiambu County we can only have EPSG:4326 - WGS 84 or EPSG:21037 - Arc 1960/UTM zone 37S or EPSG:32737 - WGS 84/UTM zone 37S. More info - Coordinate Systems Worldwide
If you have a georeferenced image or aerial imagery, you will need to import them using the Add Raster Layer button.
1. Click on the Layer menu, mouse-over Add Layer and click on Add Raster Layer... or click on the Add Raster Layer icon in the left column of QGIS.
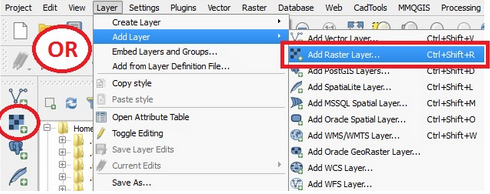
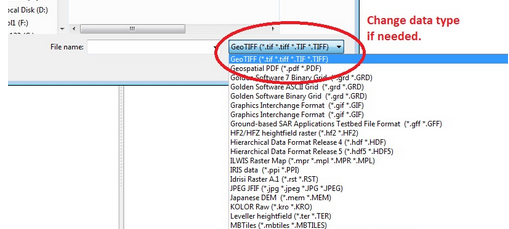
2. You will automatically be directed to your folders. Go to the folder where your rasters are stored and change the raster data type if needed by click on the drop-down menu next to the file name. Click Open.
Sometimes, data are already available, organized, and stored in a database
To understand what is contained in your database, a procedure known as querying is performed
A query is an inquiry into the database about any kind of information contained within that particular database, allowing you to extract variables of interest
Querying also allows you to
Before you begin querying your data, you should
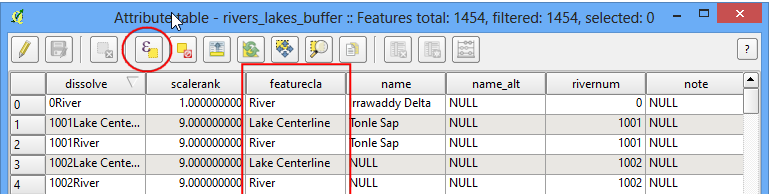
Overview of how to query in QGIS
Work with operators
Load .csv data to work on. Lets begin...
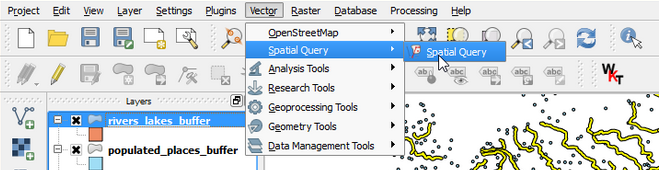
Spatial query
Prevalence is expressed as a percentage (5%, or 5 people out of 100), or as the number of cases per 10,000 or 100,000 people - weighting, during specified time period
A measure of a condition in a population at a given point in time. How is prevalence estimated?
$$ {Prevalence =\frac{Number-of-existing-cases-with-condition}{Total-number-of-people-at-risk}} $$
Prevalence reporting depends on how common the characteristic is in the population
This is number of new occurrences of a condition (or disease) in a population over a period of time - infectious disease
The incidence rate uses new cases in the numerator; individuals with a history of a condition are not included. The denominator for incidence rates is the population at risk.
$$ {Incidence =\frac{Number-of-new-cases-with-condition}{Total-number-of-people-at-risk}} $$
Science of Where, for Why