Spatial Epidemiology

Spatial Epidemiology

Tracking & explaining disease

Study of geographic distribution of disease & disease cases, to predict, control, & understand sickness and health

  • Mapping of disease
  • Identify Pattern, Distribution & Effects of Disease
  • Geographic correlation - relate events
  • Prediction - elusive for now

Mapping of Disease

Disease is affected by;

Natural factors

Human factors

Pattern, Distribution & Effects of Disease

Epidemiology is concerned with the frequency and pattern of health events in a population

Frequency refers not only to the number of health events such as the number of cases of diabetes in a population, but also to the relationship of that number to the size of the population

Pattern refers to the occurrence of health-related events by time, place, and person

Geographic Correlation

Geography and health are intrinsically linked

Here, we study geographical factors (e.g. environmental variables (quality of surrounding space), socioeconomic and demographic statistics (income and race), or even lifestyle choices (nutrition or diet)) and their effects on geographically differentiated health outcomes

Geography of disease is influenced by social, economic & political vulnerability

Distribution of disease is a result of human actions & conditions

I 💗 epi

Descriptive Epidemiology

Descriptive Epidemiology

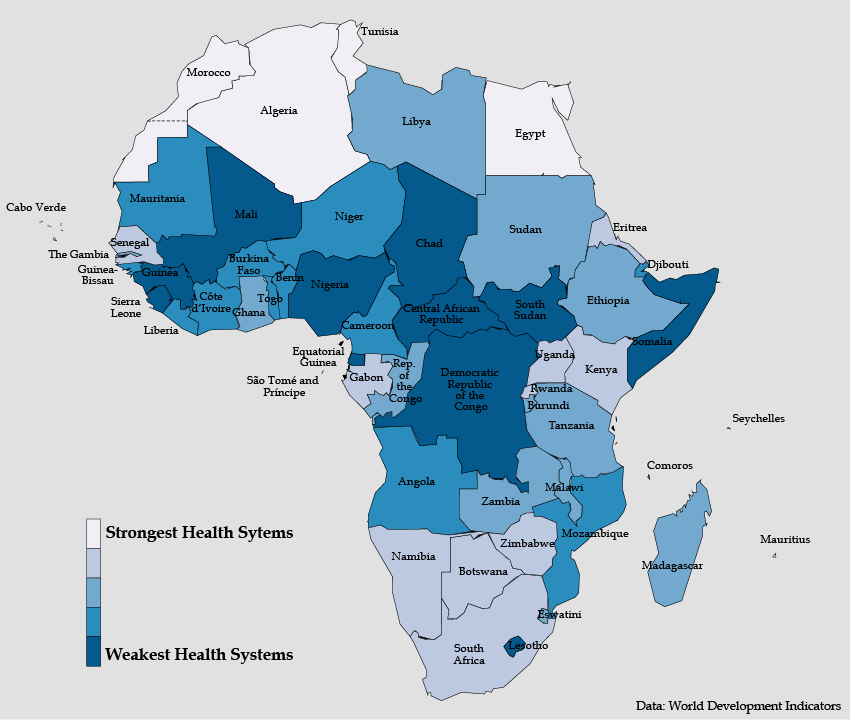
Maps are useful to describe disease & generate hypothesis e.g chloropleth maps

  • Higher risk of disease in same regions?
  • Underlying factors?
  • Under-reporting?
components

Descriptive Epidemiology

Limitations

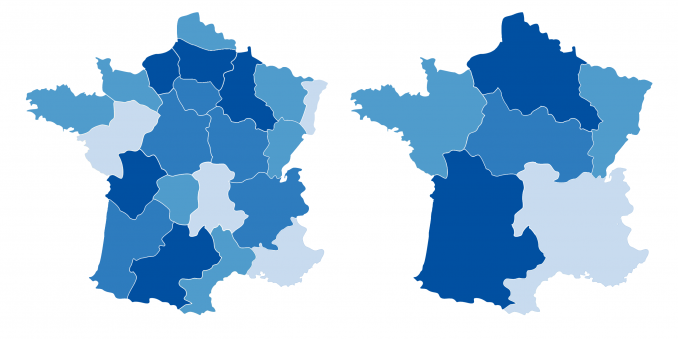
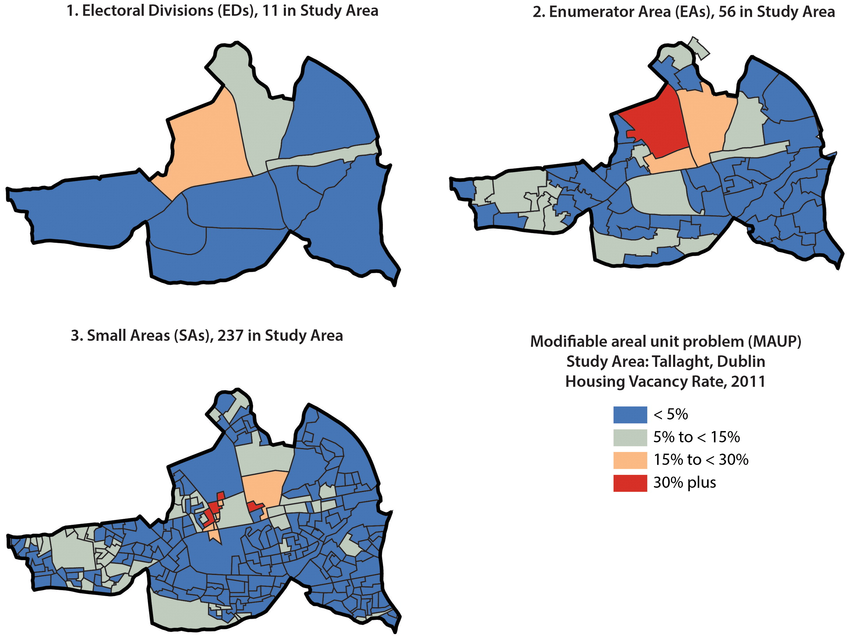
  • Apparent patterns can be created or lost artificially depending on; the geographic scale or resolution (modifiable area unit problem - maup) & how the mapped variable is categorized
  • Data quality: mapping does not improve the quality of your data
  • Random variation, especially sparcely populated areas with large variability in the estimated risk. standardize/normalize data

MAUP - Geographic Resolution

MAUP - Geographic Resolution

MAUP - Categorization

Random Variation Problem

Analytical Epidemiology

Analytical Epidemiology

Geographic correlation studies - Disease vs environmental, socioeconomic, demographic & lifestyle factors

Limitation = ecological fallacy - standardize/normalize data

Generate hypothesis

GIS very useful e.g. overlay satellite images

Common errors in Spatial Analysis

Locational fallacy

  • Errore due to the particular spatial characterization chosen for the elements of study, in particular choice of placement for the spatial presence of the element

Atomic fallacy

  • Errors due to treating elements as separate 'atoms' outside of their spatial context. The fallacy is about transferring individual conclusions to spatial units

Ecological fallacy

Ecological fallacy

Results from aggregated data (e.g. counties) cannot be applied to individual people

Example; if low income counties have high crime rate, One cannot assume low income people commit crimes, maybe they don't money to pay for police

Types of Studies

Ecological study - map individual cases

Semi-ecological study - map proxies or cohort or control

Clustering or hotspots mapping - used for infectious or chronic disease to check nature of distribution for information

Confidentiality Issues

  • Point data (xy) = address
  • Small scale aggregated data = neighbourhood

😄

Introduction to GIS

Objectives

  • Learn basic GIS concepts and terminologies
  • Learn about main GIS data types
  • Learn about GIS map projections

What is GIS?

A GIS is an organized collection of computer hardware, software, geographic data, and personnel designed to effectively capture, store, retrieve, update, manipulate, analyze, and display all forms of geographically referenced information

GIS is a computer system capable of assembling, storing, manipulating, and displaying geographically referenced information, (i.e., data identified according to their location)

It is an integrated system of computer hardware and software coupled with procedures and a human analyst which together support the capture, management, manipulation, analysis, modelling and display of spatially referenced data
GIS uniqueness

GIS handles SPATIAL information

- Information referenced by its location in space

GIS makes connections/relationships between activities based on spatial proximity

GIS Today

GIS is an information technology that integrates spatial data and information from various sources for mapping, monitoring & modelling

Maps today are colorful, searchable, interactive, and shared - the key technology behind all this GIS

GIS - can help us understand and relate to the "what," "when," "how," and "why" of the world by answering "where." - The science of where

GIS is used to; ask questions, inform choices, and guide policy

Geographic Data

Geographic data refers to features that have a spatial component

These features are commonly referred to as spatial data layers

A spatial data layer is composed of two components: spatial data, or the location of a feature (i.e., latitude and longitude); and attribute data, or information about the feature

Spatial Data Models

  1. Vector data
  2. Raster data

Vector Data Model

Uses geometry primitives to represent discrete objects

  • Points (locations of health centers, schools, towns)
  • Lines (rivers, roads, rails)
  • Polygons (boundaries, regions, lakes)

File Formats for Vector Data

ESRI shape file

  • .shp - stores geomerty
  • .shx - index file
  • .dbf - attribute file

KML/KMZ

  • Uses hierarchical tags to represent geographic features, along with their non-spatial attributes

Geojson

  • Uses objects to represent geographic features, along with their non-spatial attributes

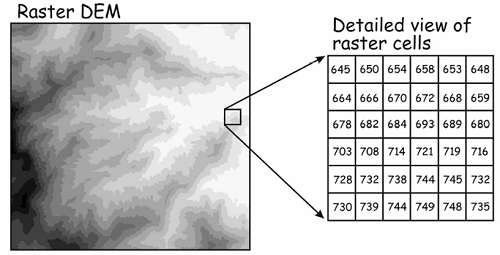
Raster Data Model

Uses grid cell to represent geographic features

Raster model is best for representing

  • Gradients
  • Data from remote sensing imagery, collected in grids
  • Topographic data

File Formats for Raster Data

.TIFF

.PNG

.JPG

Coordinate Systems & Map Projections

Coordinate system is a reference system used to represent the locations of geographic features, imagery, and observations such as GPS locations within a common geographic framework

Types of coordinate systems used in GIS

  • Geographic (spheroid or 3D) coordinate system such as latitude-longitude, units of measurement are degrees
  • Projected (planar or 2D) coordinate system such as Transverse Mercator, Albers equal area, or Robinson. Units of measurement are either metric or statute

Coordinate reference systems are used to accurately identify locations on the Earth's surface

Concept of Projection

Mapping Process

  1. Frame your purpose. In other words, what do you want to know about your data?
  2. Collect available data to achieve your purpose
    • Is existing data available?
    • Sources of data?
    • Do you need to collect data?
    • Do you need to digitize data?
  3. Determine whether purpose is achieved using a geographical approach
    • Would a chart, graph, or table be a better format to communicate your findings?
    • Are you interested in displaying values or do you need a map to reveal patterns or relationships in the data?
  4. Select a method or combination of methods to help realize your purpose

GIS Software

Download, install QGIS

Search QGIS website https://qgis.org/en/site/forusers/download.html

GPS Android App

Download, install GPS Essentials via Google Play store

😀

Goodbye!!!

Science of Where, for Why